Two Points Make a Line
Telling stories through visualized data — by Kenneth S. Reyes
About
Categories
All
(28)
D3/OJS
(11)
R
(19)
ggplot
(15)
highcharts
(3)
leaflet
(1)
python
(5)
Two Points Make a Line
Telling stories through visualized data — by Kenneth S. Reyes
The economics of tariffs
Thinking clearly about the costs and benefits of taxing imports. Plus an aside on that odd tiny cross by the Marienkirche entrance
D3/OJS
Apr 17, 2025
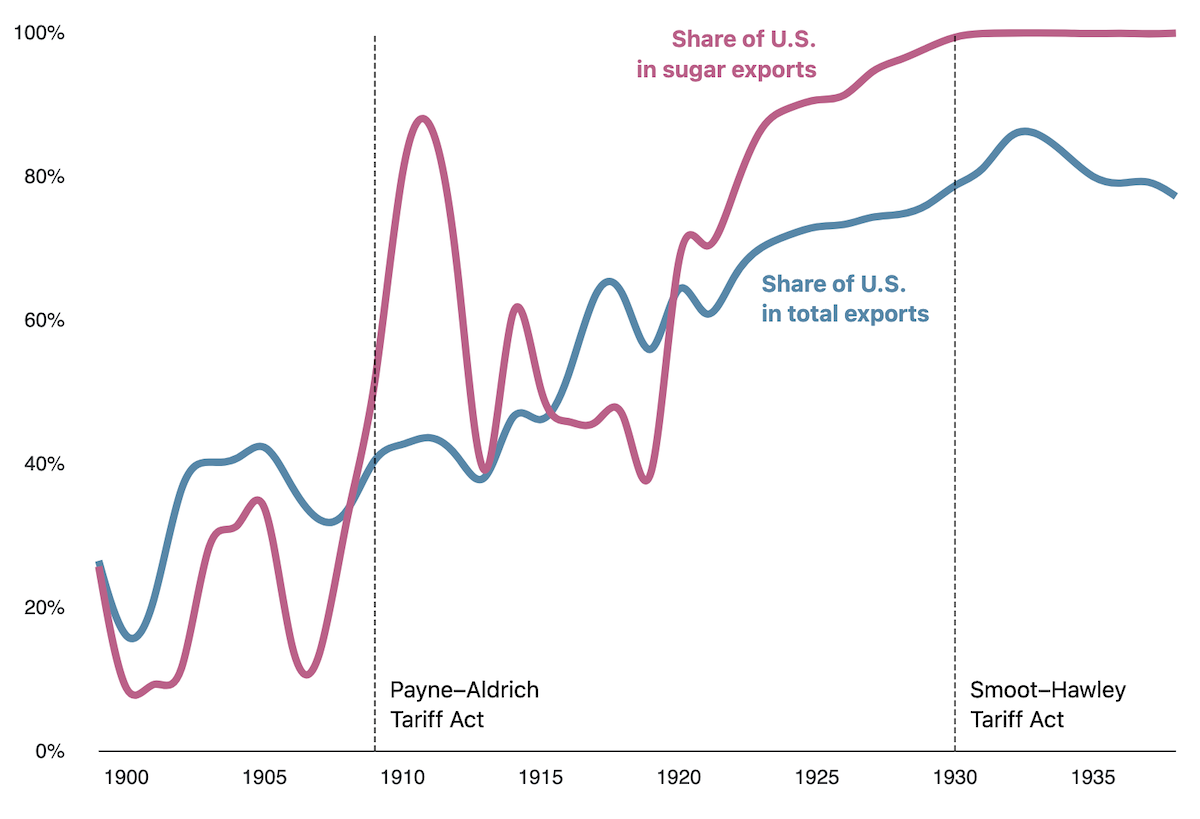
To seek another’s profit
One hundred years ago, the U.S. granted the Philippines access to its highly protected markets. What seemed like a sweet deal came with a cost
D3/OJS
Apr 9, 2025
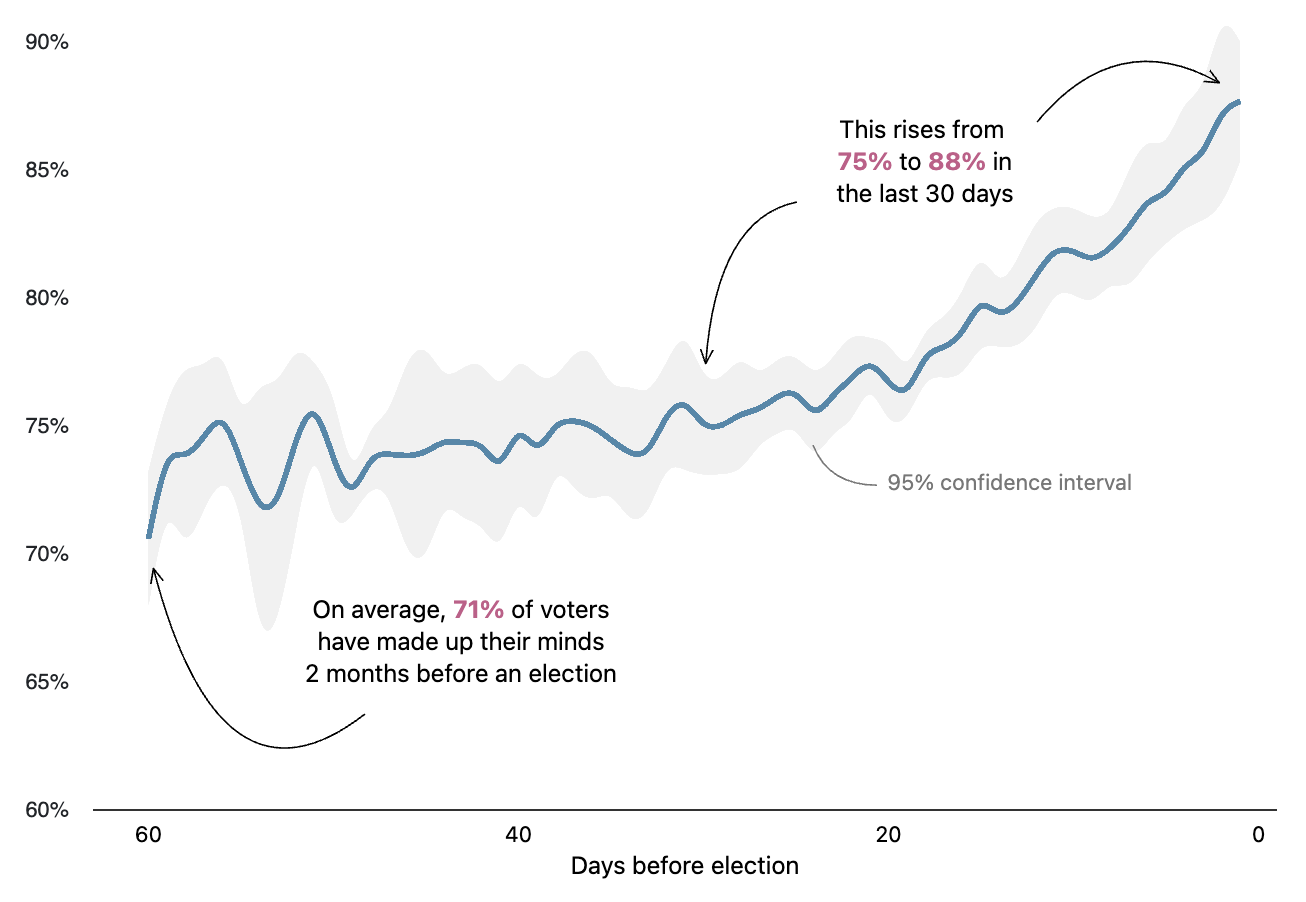
In persuasion nation
Seventy years of surveys tell us that two weeks before an election, about 20% of votes are still up for grabs
python
D3/OJS
May 29, 2023
The wealth detective
This year’s John Bates Clark Medal has been awarded to Gabriel Zucman, maestro of tax data and scourge of the ultra wealthy. Here is a visual retrospective of his work.
python
D3/OJS
May 9, 2023
Babies and boomers
Humanity is rapidly aging everywhere except Africa
python
D3/OJS
Apr 30, 2023
The tales we tell
Our body of folklore can say a lot about our modern-day attitudes and beliefs — for better or worse
python
D3/OJS
Apr 22, 2023
Learning curves
Charts have been aiding — and confusing — students of economics for generations. Give them a fresh twist by adding interactivity.
D3/OJS
Apr 14, 2023
That’ll be ₱1 billion please
A bike lane building blitz from the pandemic era offers a glimpse into the Philippine government’s procurement process
R
D3/OJS
Apr 6, 2023
People as particles
Population density in cities, portrayed more vividly
D3/OJS
Mar 29, 2023
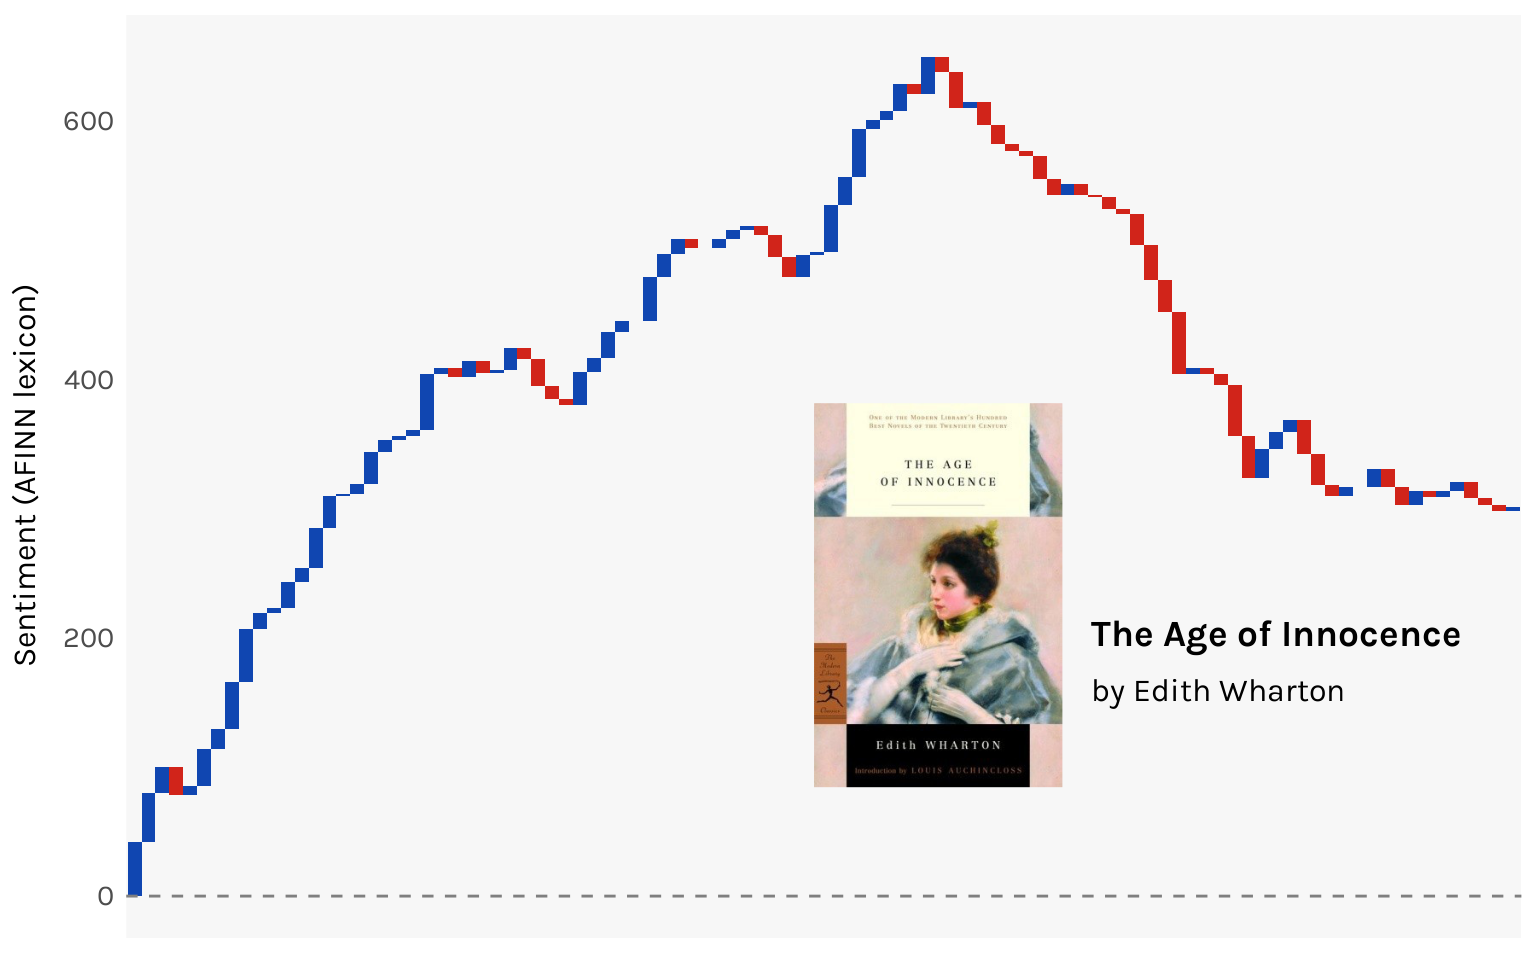
I just read 456 books*
*Actually my computer did, but let’s not split hairs. An exploration into NLP, dimensionality reduction, and reactive visualizations.
python
D3/OJS
Mar 22, 2023
Telling the future is hard
A forecasting tournament put the predictive powers of social scientists to the test. They, ah, didn’t do so well.
R
ggplot
D3/OJS
Mar 12, 2023
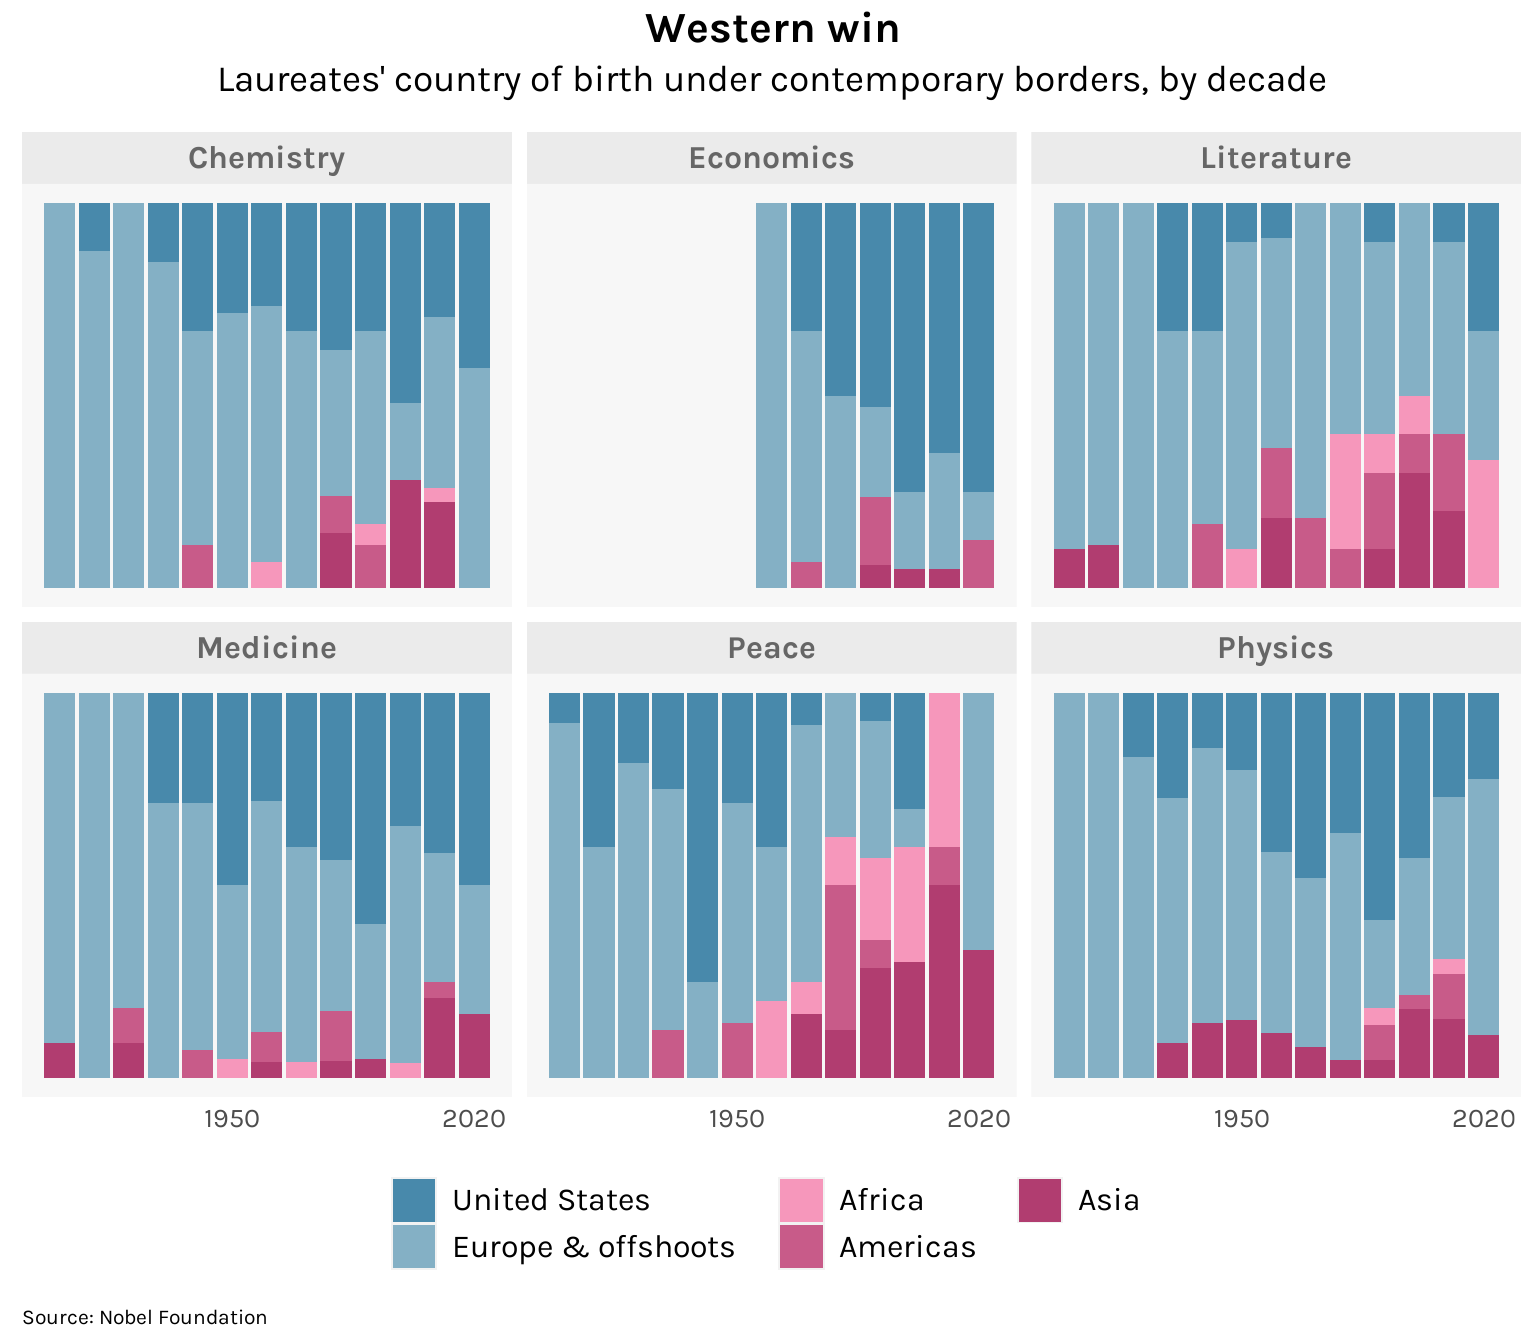
The demographics of Nobel laureates
I’m starting to think there might be privileges to being old, white, and male
R
ggplot
Mar 3, 2023
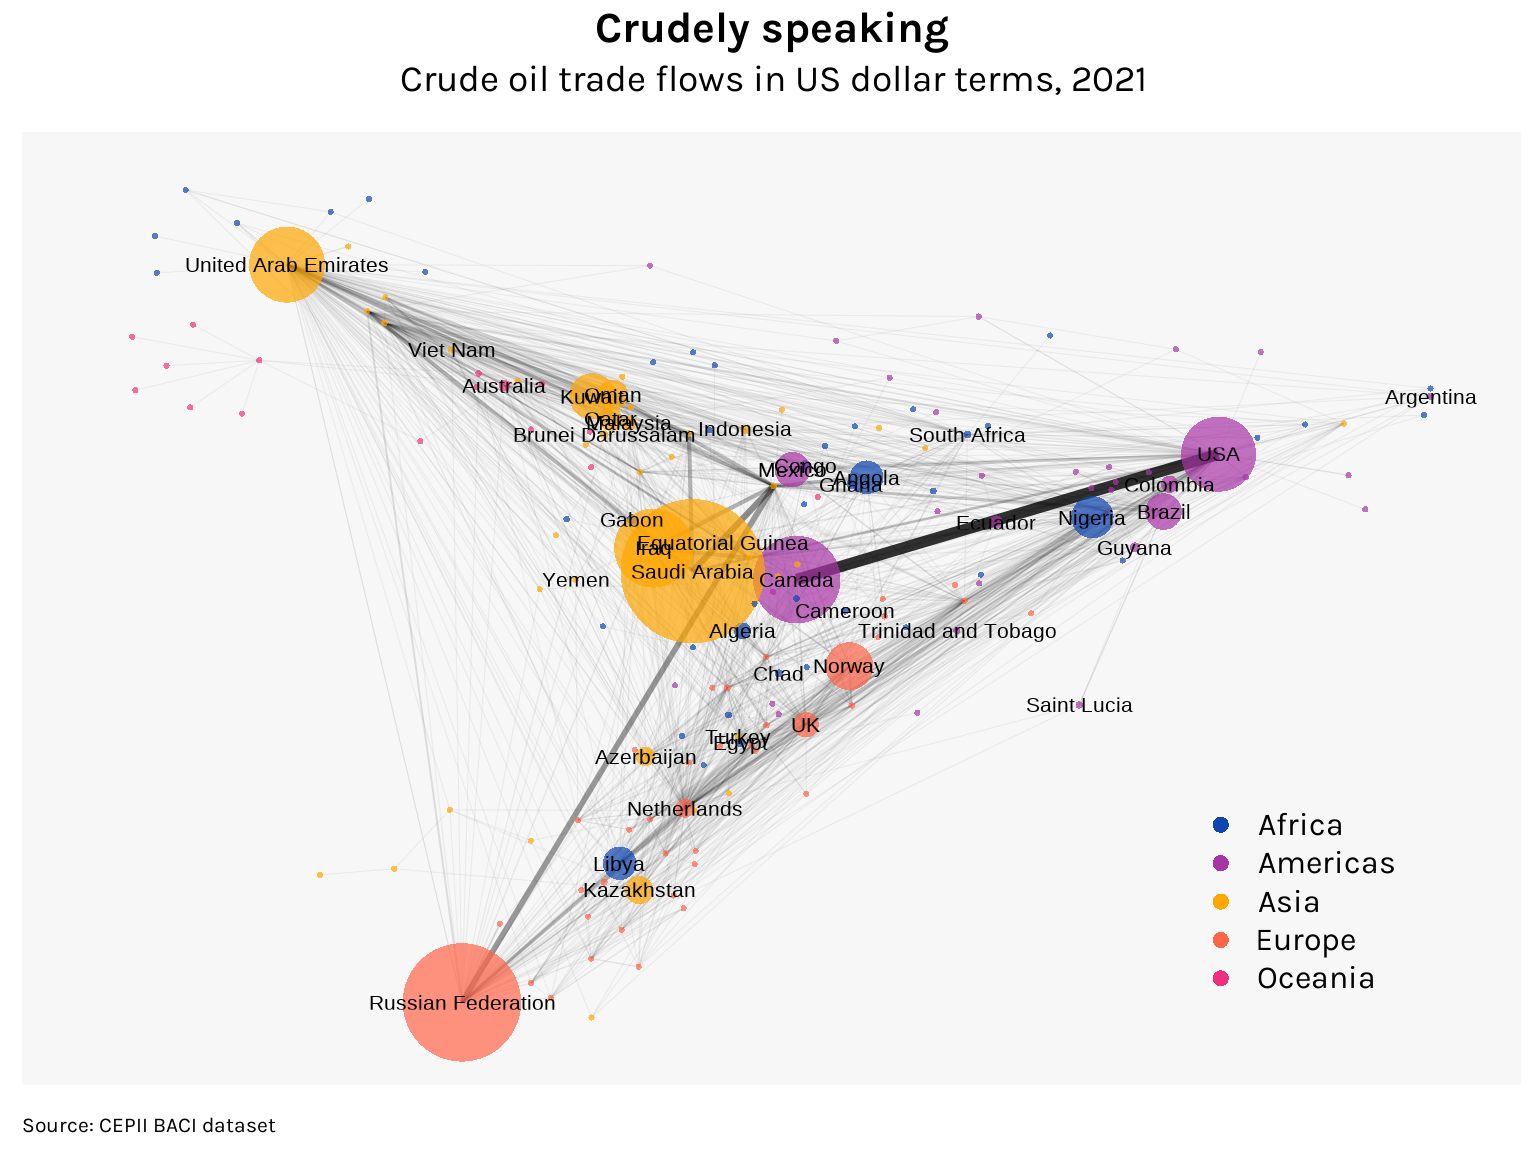
Putin’s leverage, Putin’s folly
A newly released dataset lets us visualize the patterns of global trade on the eve of Russia’s invasion of Ukraine
R
ggplot
Feb 22, 2023
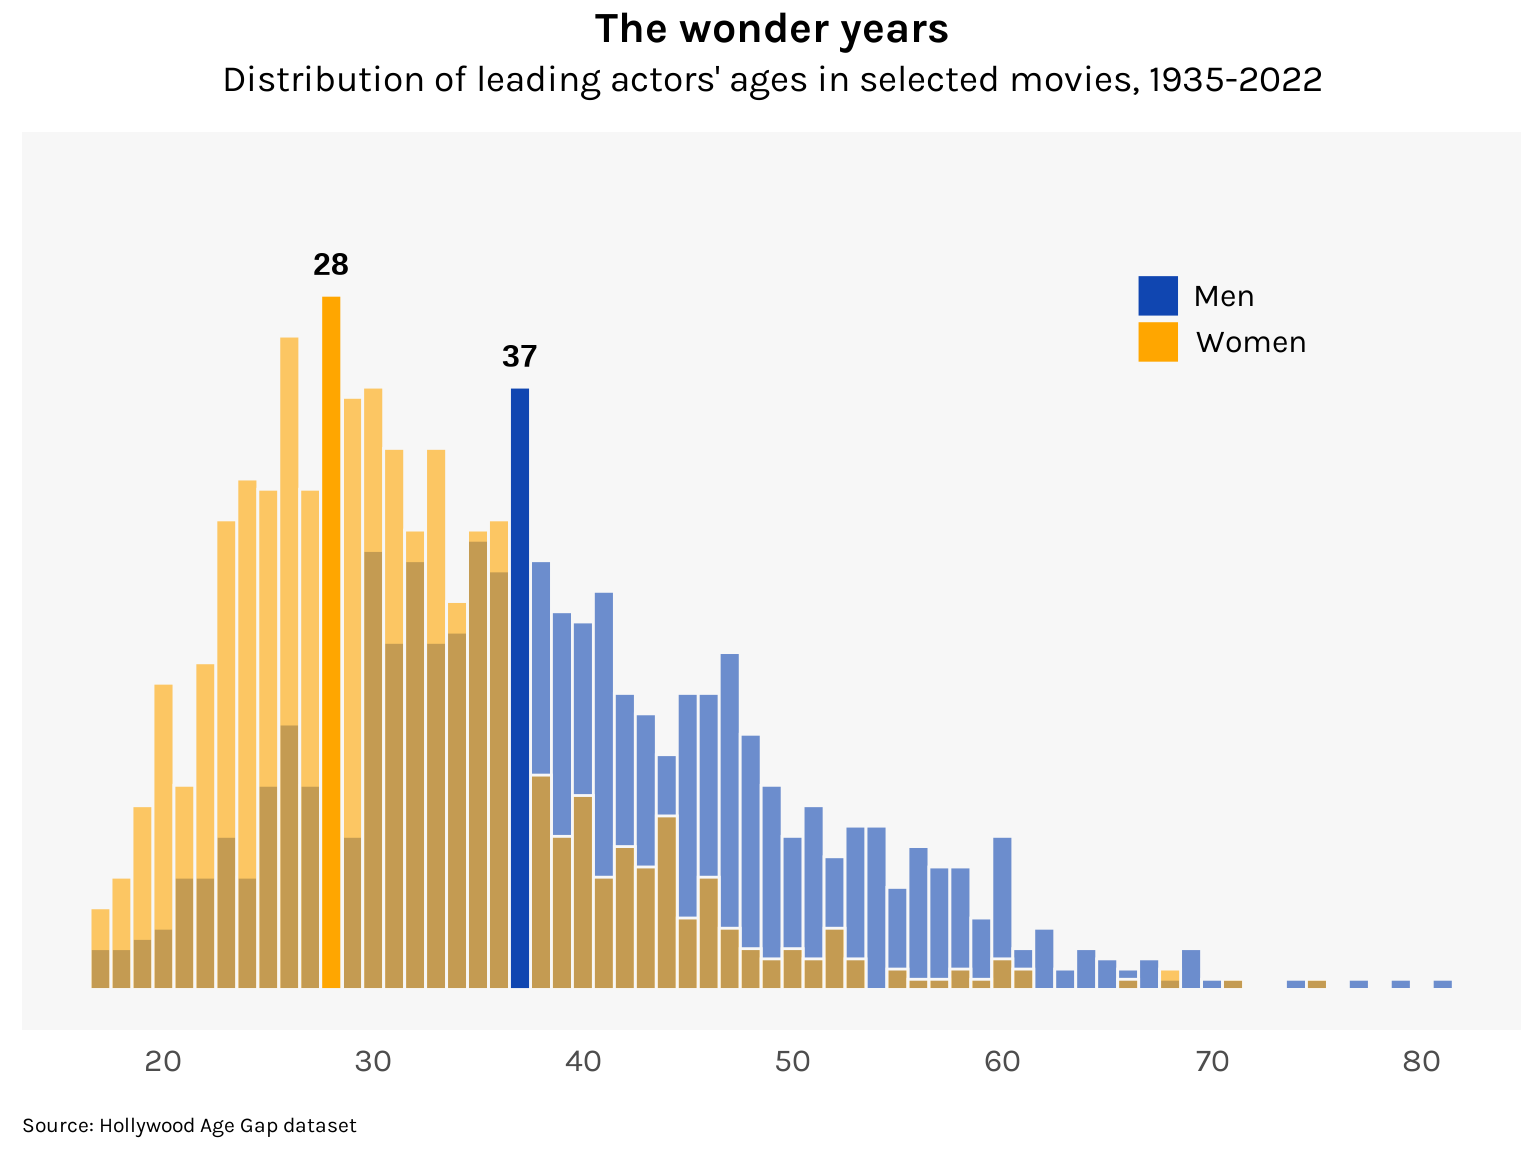
The standard age
At what age are we our “standard” selves, when we are neither too young nor too old?
R
ggplot
Feb 14, 2023
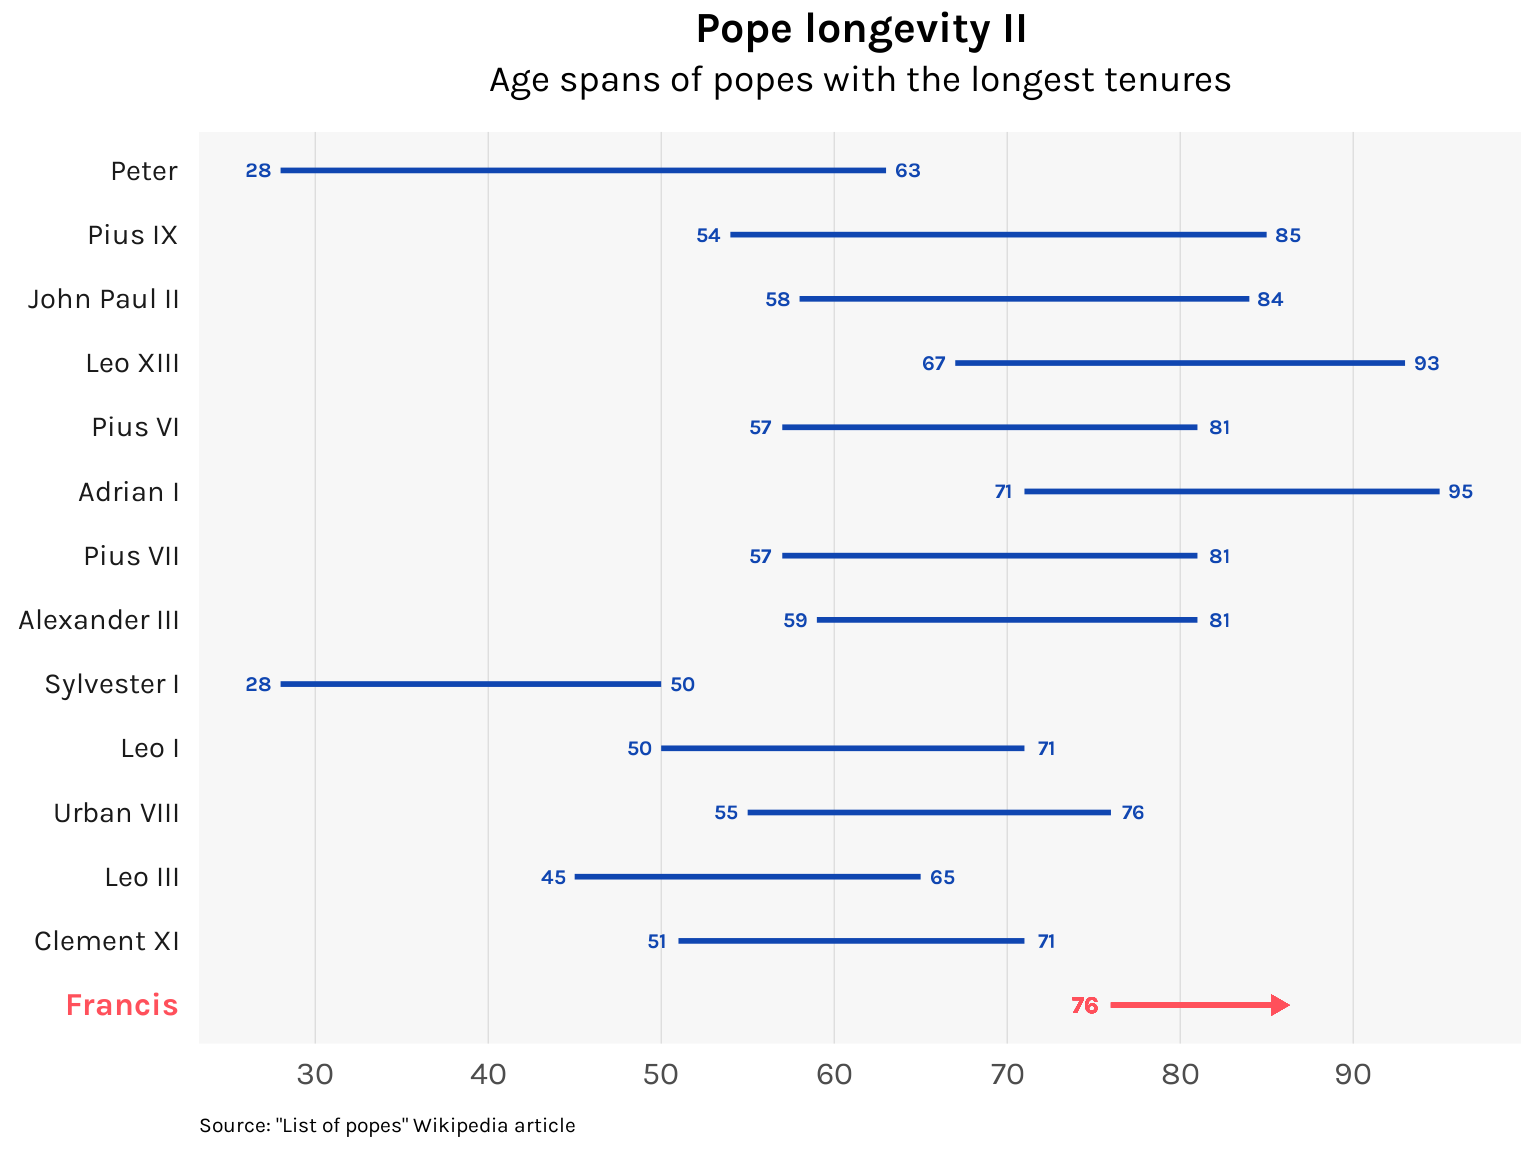
Francis is an old pope
At 86, the current supreme pontiff is making his mark as one of history’s oldest. How long can he go on?
R
ggplot
Feb 6, 2023
Will people care about this Oscars?
On the surprising popularity of the 2023 nominations for Best Picture
R
ggplot
highcharts
Jan 26, 2023
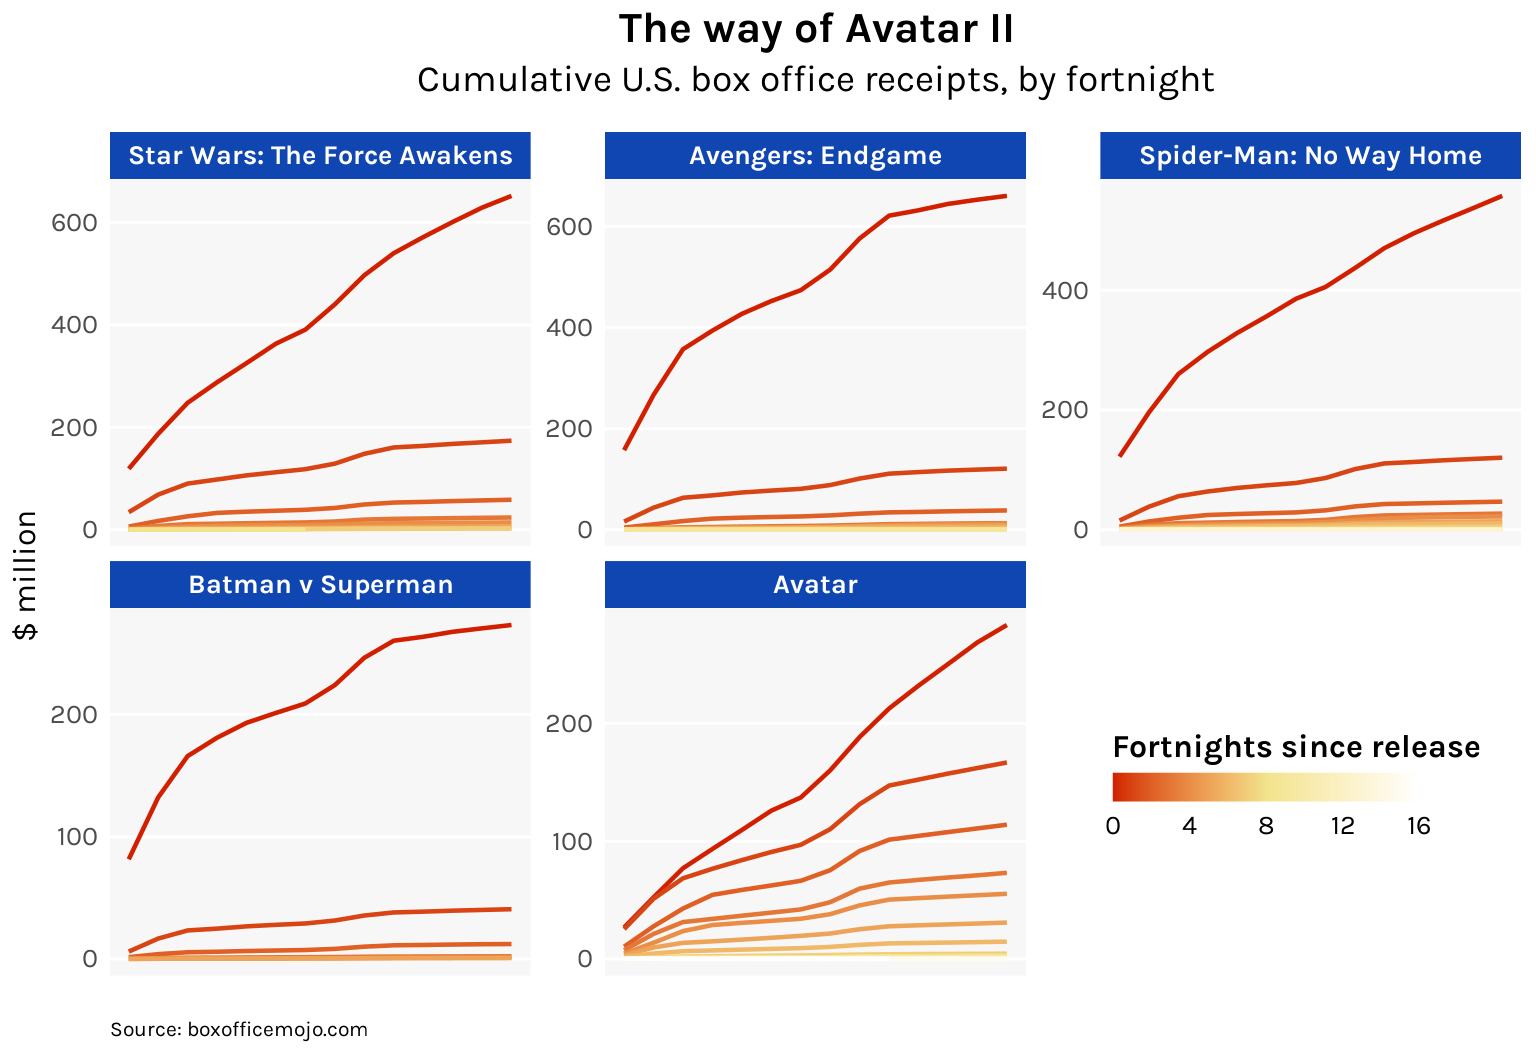
Somehow, Avatar has returned
The highest grossing movie of all time got to the top gradually rather than all at once
R
ggplot
Dec 21, 2022
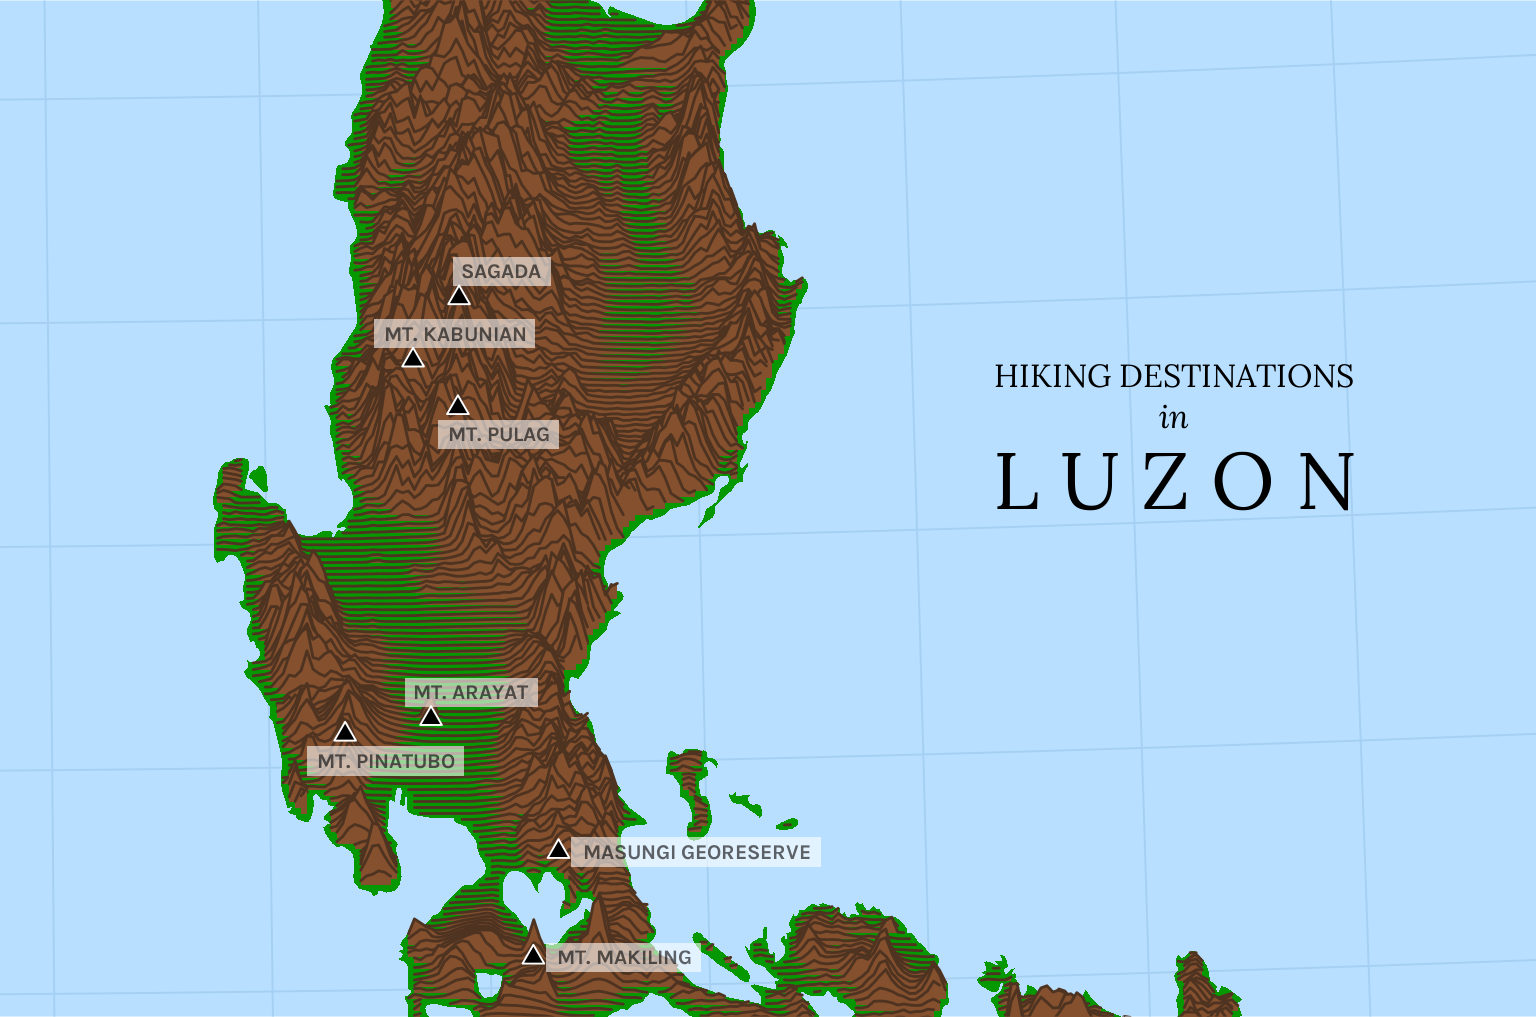
Luzon’s hiking trails
Creating a stylized map of mountains using ridgelines
R
ggplot
Dec 15, 2022
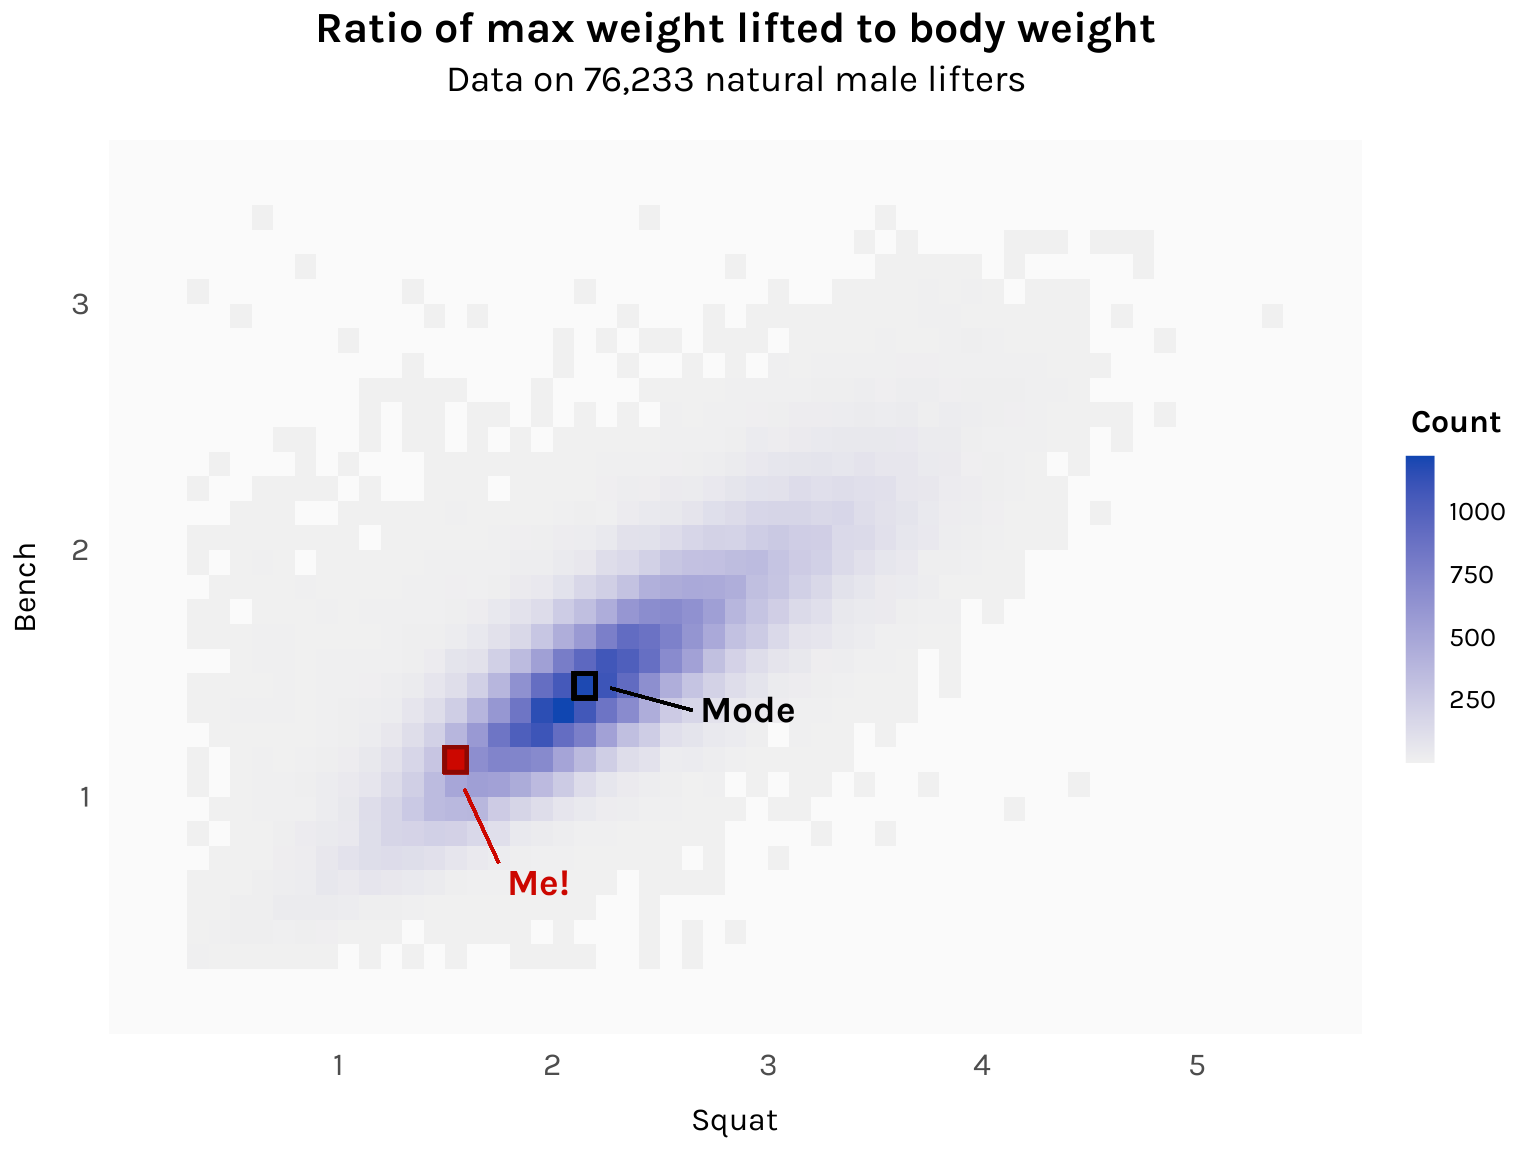
I’m gonna carry that weight
Using a massive dataset of powerlifting competitors to set my gym goals for next year
R
ggplot
Dec 7, 2022
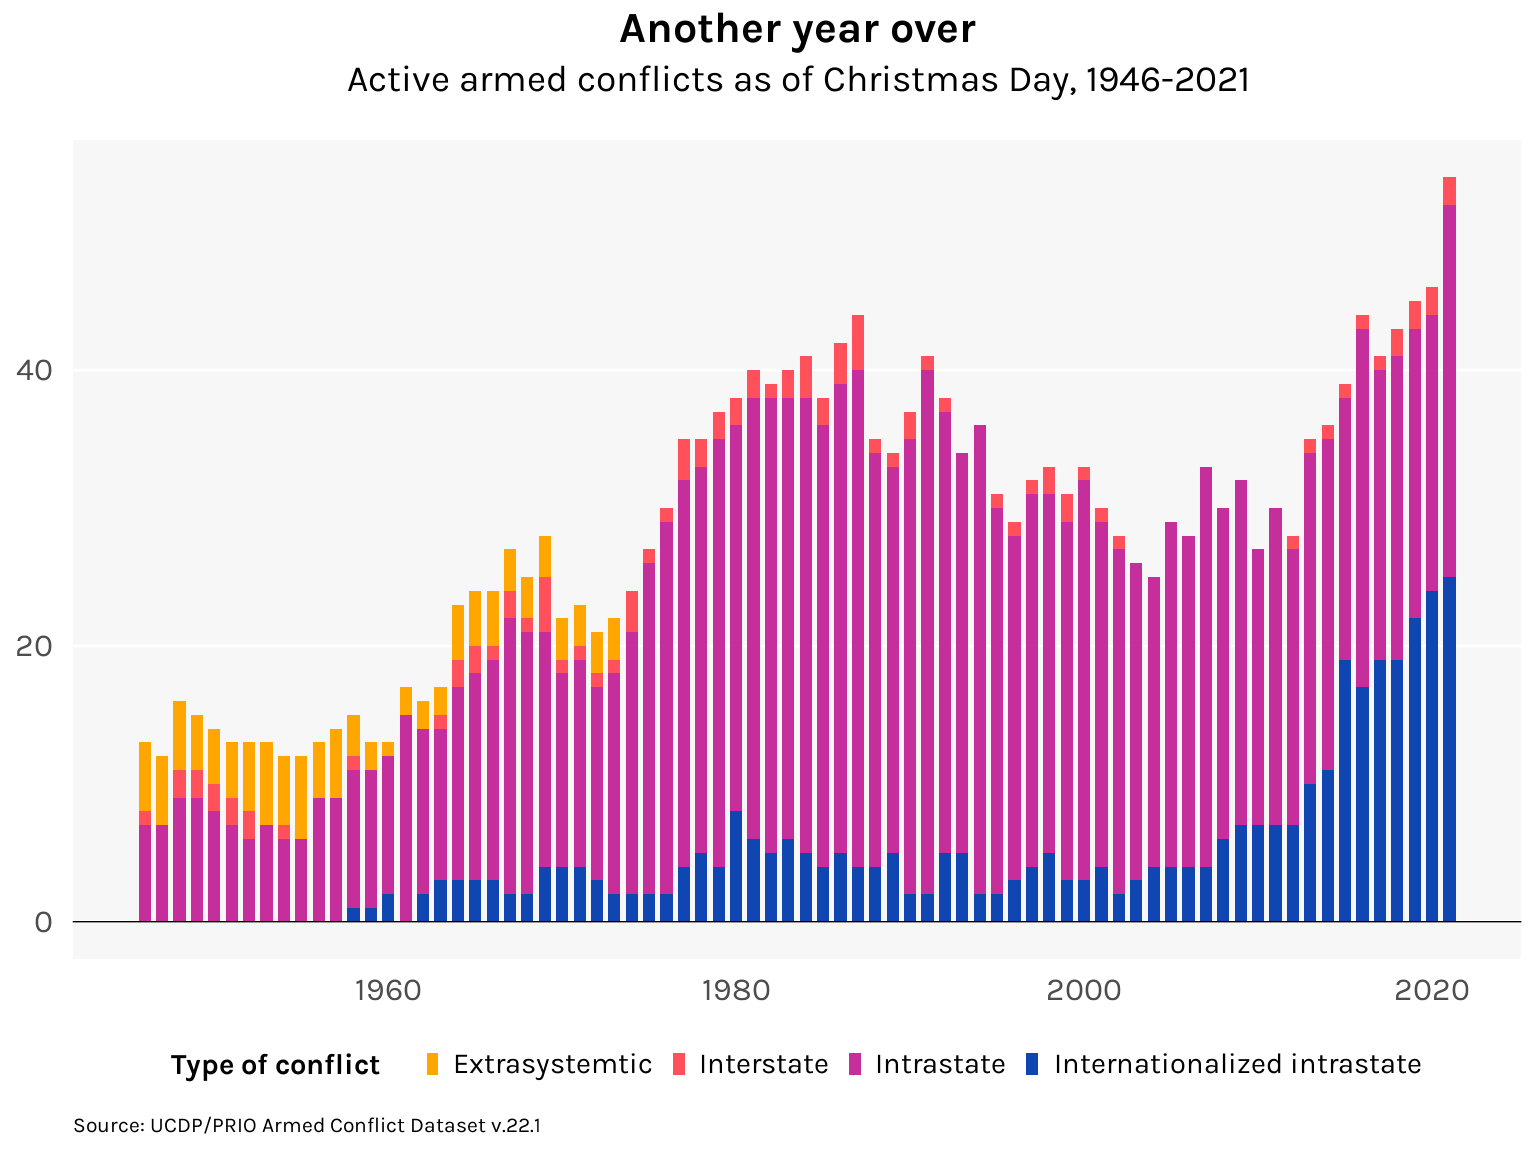
War is over (if you want it?)
A tally of active armed conflicts as of Christmas Day, since 1946
R
ggplot
Dec 3, 2022
More on the great post-1500 migrations
Which countries have the most diverse ancestors? Which countries have the most descendants around the world today?
R
highcharts
Nov 26, 2022
The roots of economic development
Visualizing some key results in Spolaore and Wacziarg’s 2013 survey
R
highcharts
Nov 25, 2022
The emotional shape of novels
Using sentiment analysis, I chart the emotional highs and lows of three classic novels
R
ggplot
Nov 19, 2022
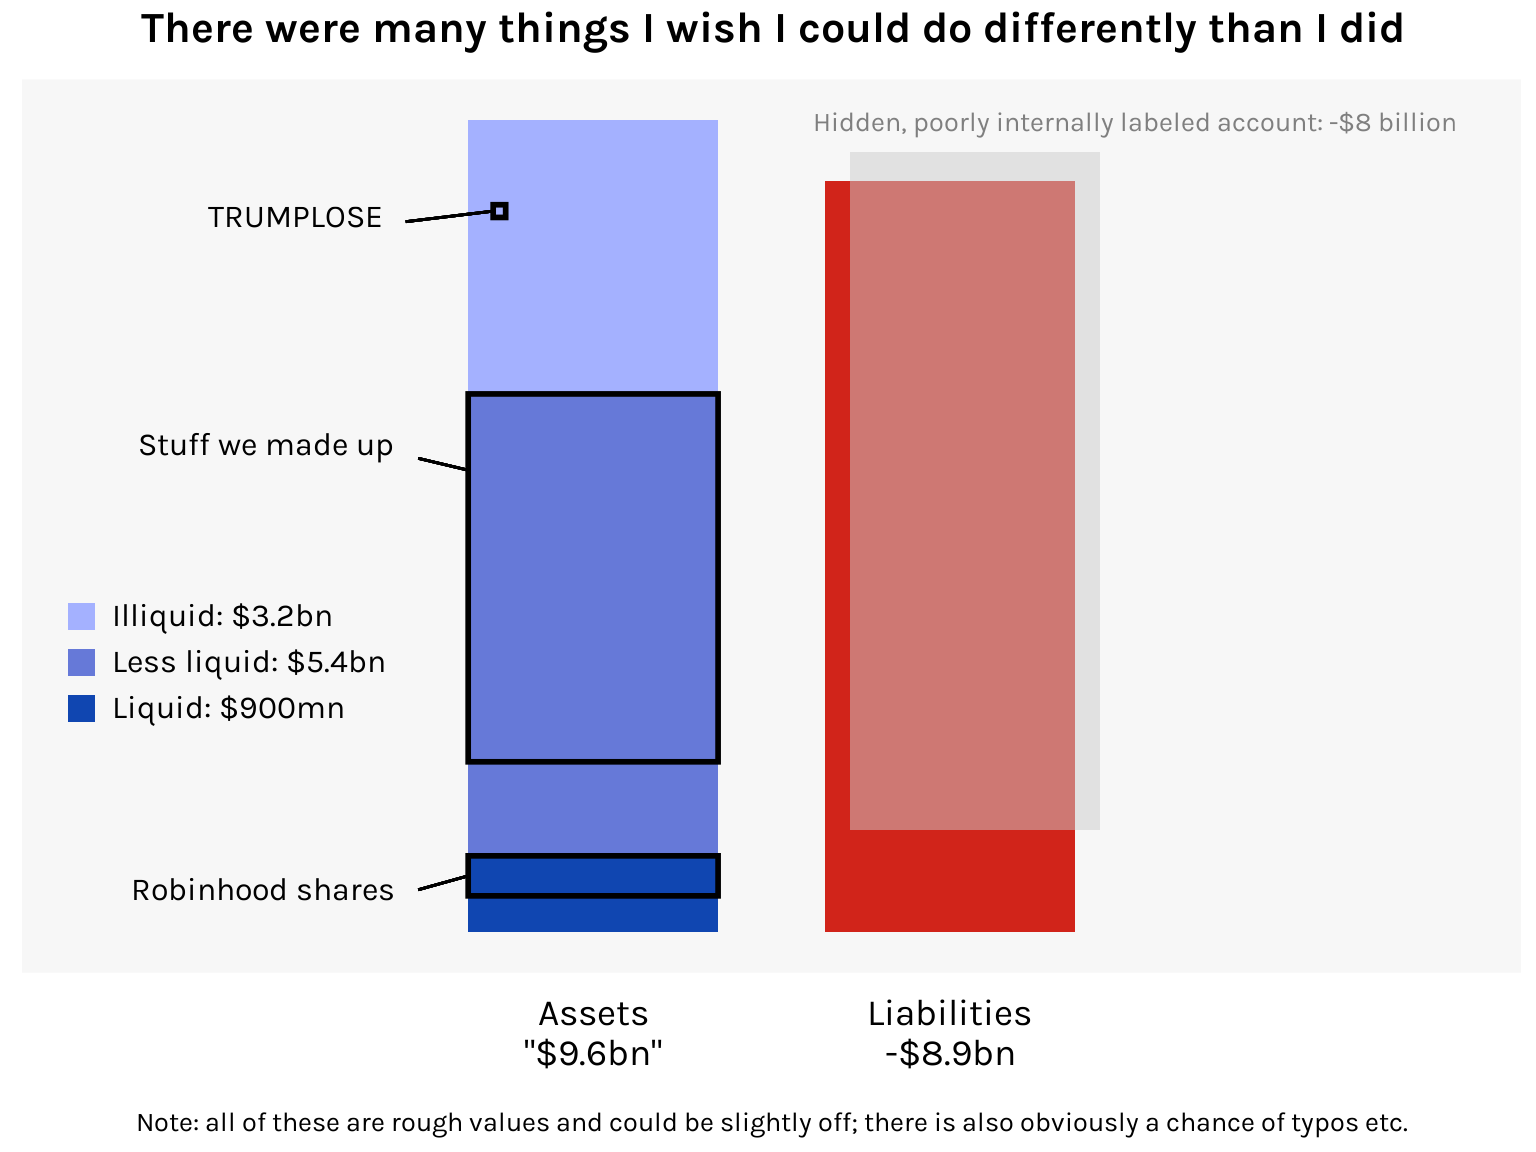
That FTX balance sheet
SBF shops around for investors with a balance sheet that is emphatically not GAAP
R
ggplot
Nov 15, 2022
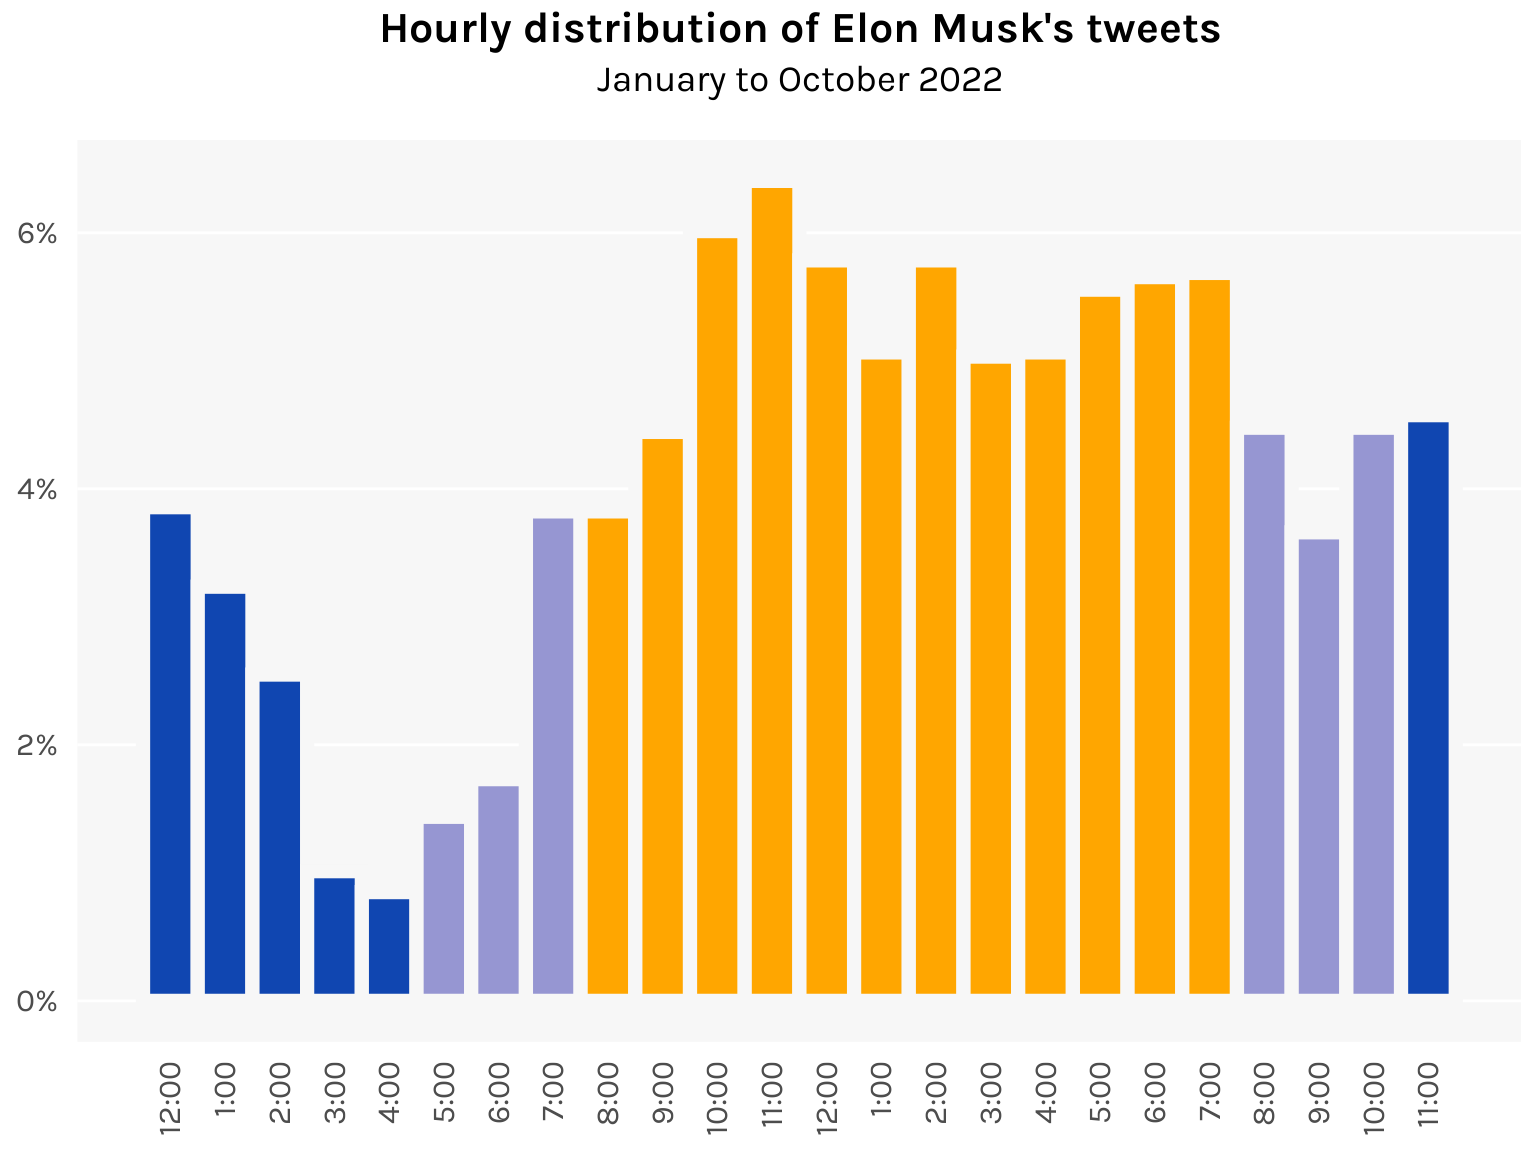
Visualizing Elon Musk’s Twitter addiction
The world’s busiest billionaire finds the time to tweet at all hours of the day
R
ggplot
Nov 13, 2022
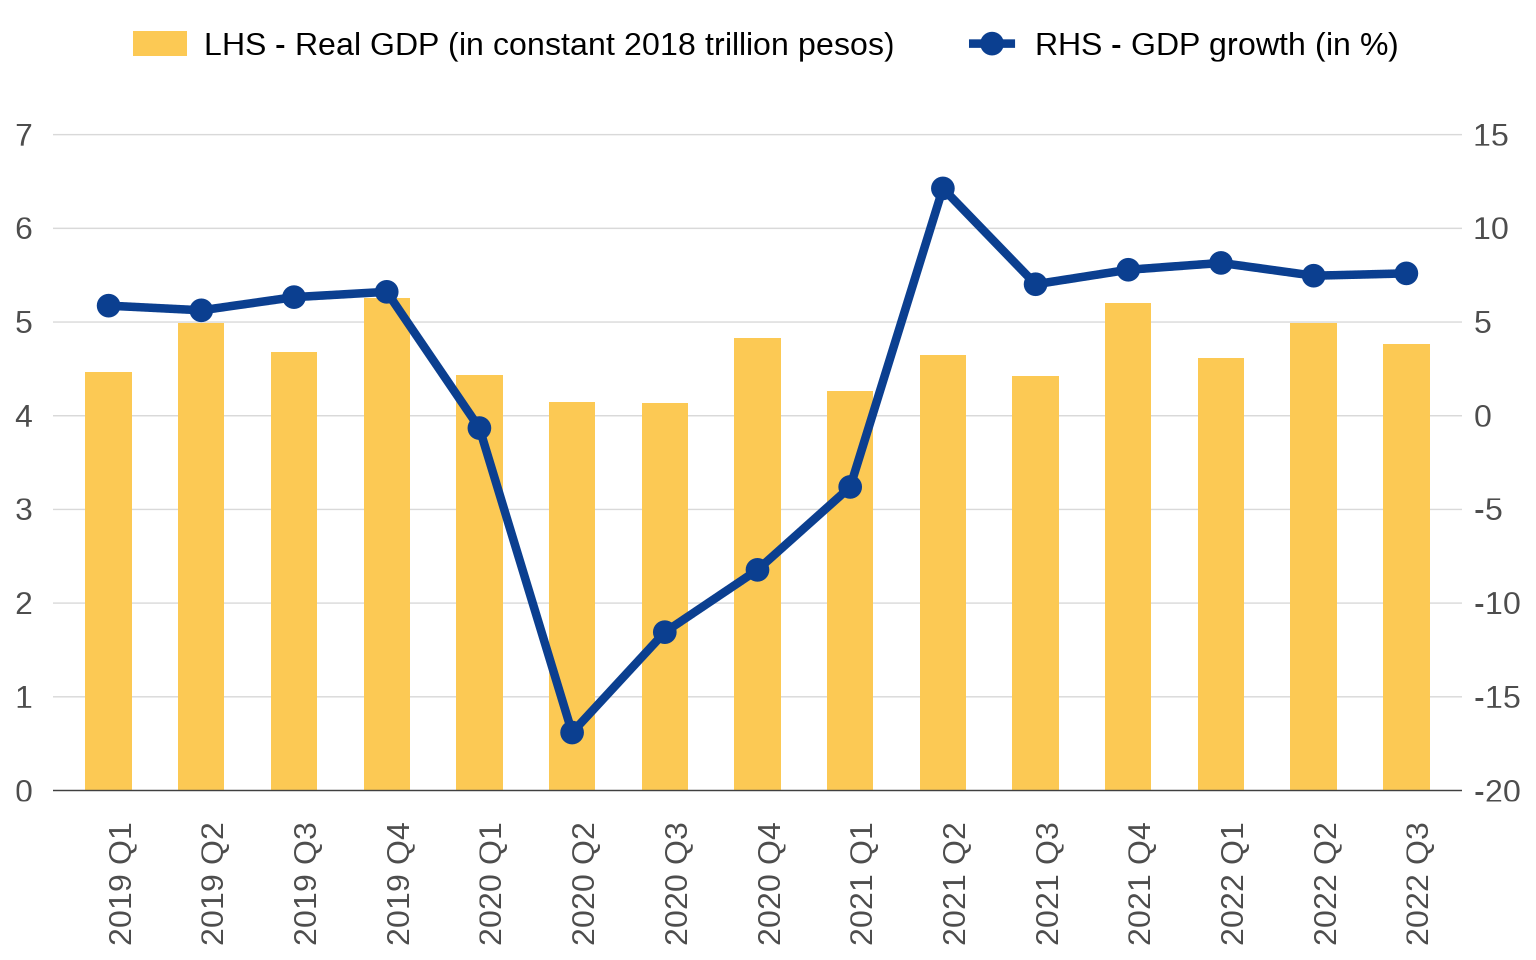
Should you dual wield y axes?
Points to keep in mind when resorting to a secondary axis
R
ggplot
Nov 10, 2022
Mapping the Metro Manila subway
In a fit of wishful thinking, I use Leaflet to map the Metro Manila subway as if it existed
R
leaflet
Nov 8, 2022
Exercises in plotting WDI data
Pull the data with R instead of downloading spreadsheet after spreadsheet
R
ggplot
Nov 5, 2022
No matching items