Francis is an old pope

At 86, the current supreme pontiff is making his mark as one of history’s oldest. How long can he go on?

R
ggplot
Published

February 6, 2023

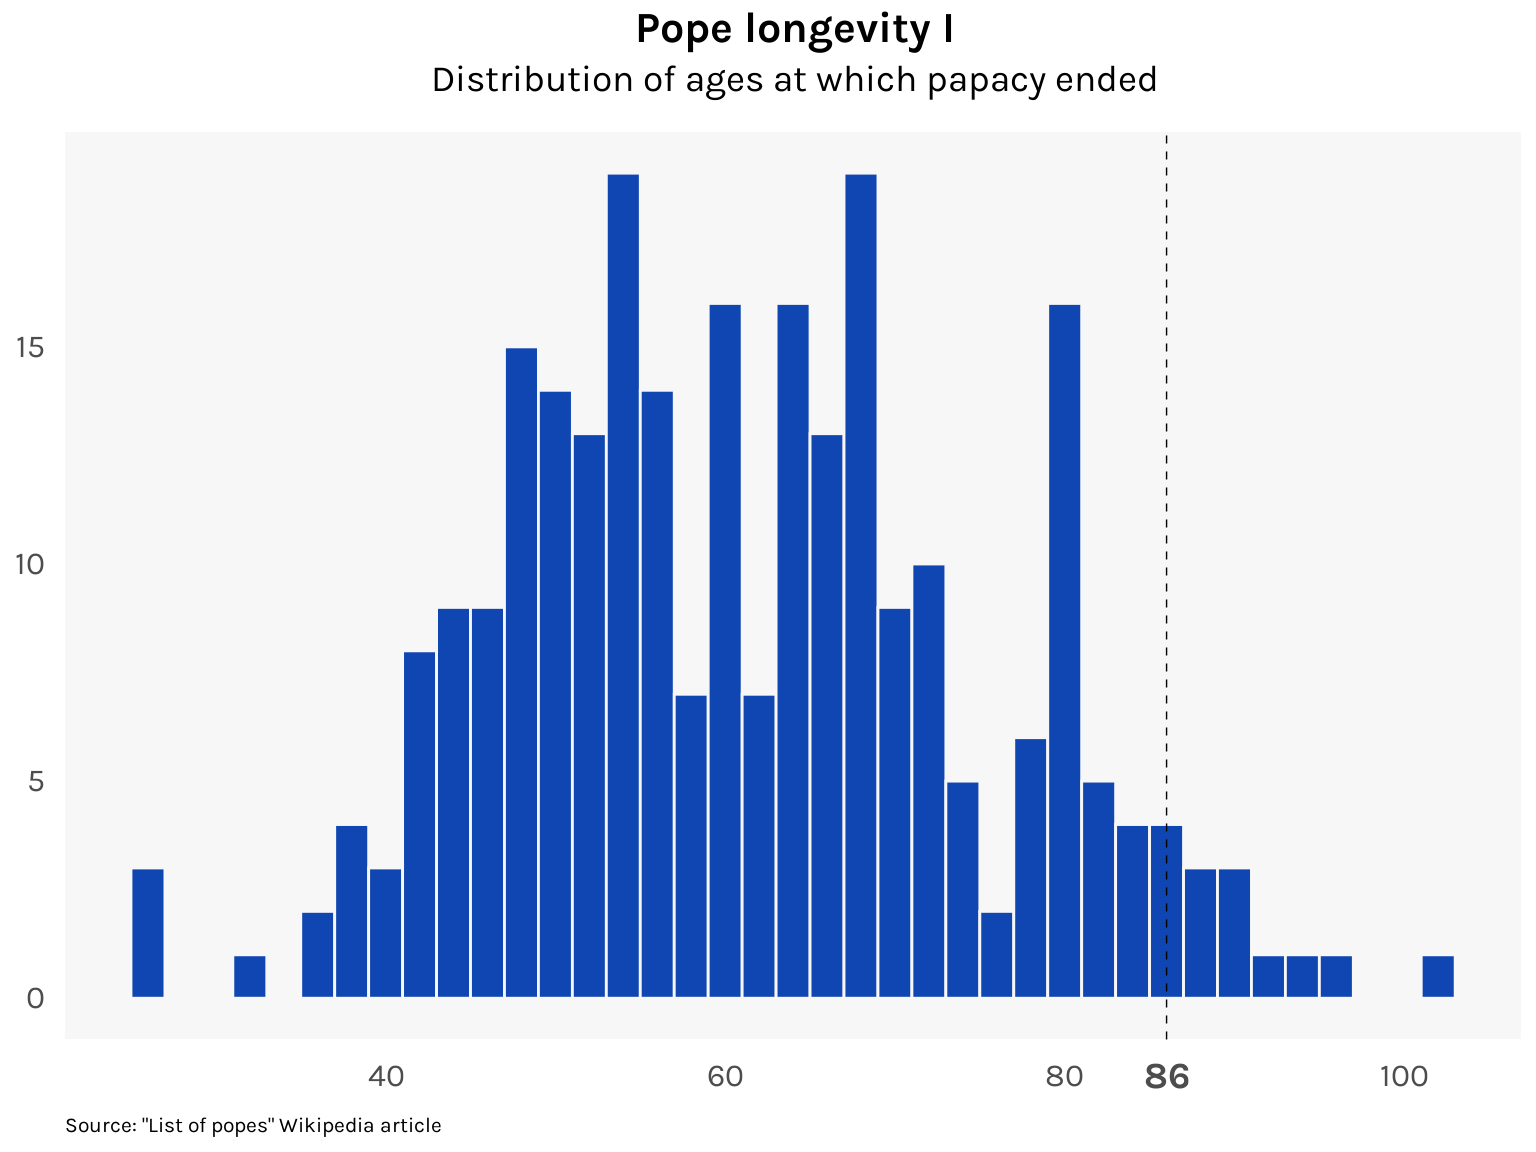
Next month, Pope Francis will mark his 10th year in the papacy. Will he make it to his 15th year? His 20th? He is already 86: the last pope to reach this age was Leo XIII, who died in 1903 at the age of 93.1 In fact, by my count, only 15 of the 264 popes in history remained pope past their 86th birthday, and only four since the year 1500. Francis is in very small company.

I thought I’d visualize this using data scraped from the Wikipedia article “List of popes”. The resulting dataset popes.csv runs from Peter to Francis and excludes all the antipopes (who I call the nopes) for a total of 267 rows and 264 unique popes. Check this repository for more info.

Here’s a look at a few entries in the dataset:

library(tidyverse)
library(knitr)

popes <- here("datasets", "popes", "popes.csv") %>%
  read_csv()

popes %>%
  arrange(-number) %>%
  head() %>%
  knitr::kable(digits = 2, align = "c")
number name_full name suffix canonization birth start end age_start age_end tenure
266 Francis Francis 1 NA 1936-12-17 2013-03-13 NA 76 NA NA
265 Benedict XVI Benedict 16 NA 1927-04-16 2005-04-19 2013-02-28 78 85 7.86
264 John Paul II John Paul 2 Saint 1920-05-18 1978-10-16 2005-04-02 58 84 26.46
263 John Paul I John Paul 1 Blessed 1912-10-17 1978-08-26 1978-09-28 65 65 0.09
262 Paul VI Paul 6 Saint 1897-09-26 1963-06-21 1978-08-06 65 80 15.13
261 John XXIII John 23 Saint 1881-11-25 1958-10-28 1963-06-03 76 81 4.60

We can use a histogram to get an idea of how rare it is for a pope to continue on past the age of 86.

Code
library(ggplot2)

popes %>%
  ggplot(aes(x = age_end)) +
  geom_histogram(binwidth = 2, fill = "#1046b1", color = "gray97") +
  geom_vline(xintercept = 86, linetype = "dashed", linewidth = .25) +

  # Labels
  labs(
    title = "Pope longevity I",
    subtitle = "Distribution of ages at which papacy ended",
    caption = "Source: \"List of popes\" Wikipedia article"
  ) +
  scale_x_continuous(breaks = c(40, 60, 80, 86, 100)) +
  theme_minimal(base_family = "karla") +
  theme(
    plot.title = element_text(size = 16, face = "bold", hjust = .5),
    plot.subtitle = element_text(size = 14, hjust = .5, margin = margin(b = 12)),
    plot.caption = element_text(size = 8, hjust = 0, margin = margin(t = 10)),
    axis.ticks = element_blank(),
    axis.title = element_blank(),
    axis.text.x = element_text(
      size = c(12, 12, 12, 14, 12), face = c("plain", "plain", "plain", "bold", "plain"),
      margin = margin(t = 5), vjust = .5
    ),
    axis.text.y = element_text(size = 12, margin = margin(r = 5)),
    panel.background = element_rect(fill = "gray97", color = NA),
    panel.grid.major.x = element_blank(),
    panel.grid.major.y = element_blank(),
    panel.grid.minor.x = element_blank(),
    panel.grid.minor.y = element_blank()
  )

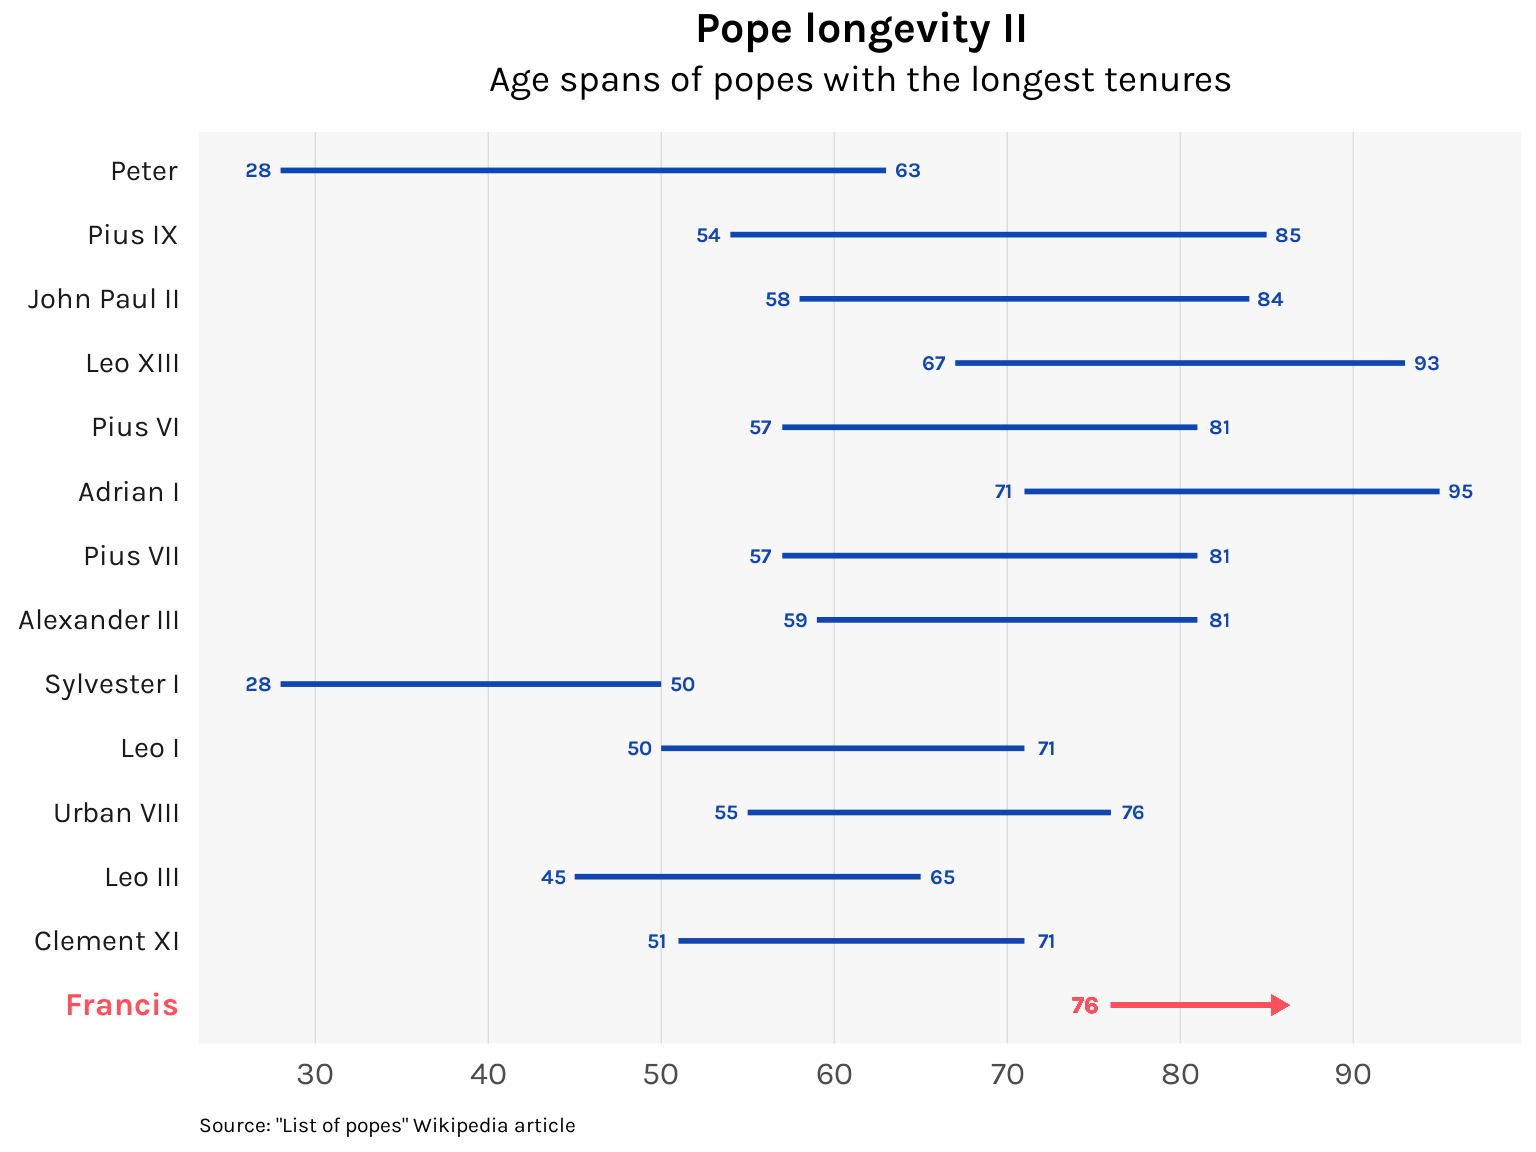
Though Francis is an old pope, his tenure so far of 10 years is less remarkable. Almost a third of all popes lasted for 10 years or more. And getting another decade in will be tough for Francis as he entered the papacy late in life — 76 years old. Of the popes with tenures of 20 years or more, most started before the age of 60, as the chart below shows.

Code
popes %>%
  filter(tenure >= 20) %>%
  bind_rows(tibble(name_full = "Francis", tenure = 0)) %>%
  arrange(tenure) %>%
  mutate(name_full = factor(name_full, name_full)) %>%
  ggplot() +
  geom_segment(aes(x = age_start, xend = age_end, y = name_full, yend = name_full),
    linewidth = 1, color = "#1046b1"
  ) +
  geom_text(aes(x = age_start, y = name_full, label = age_start),
    family = "karla",
    size = 8 / .pt, fontface = "bold", color = "#1046b1", nudge_x = -1.25
  ) +
  geom_text(aes(x = age_end, y = name_full, label = age_end),
    family = "karla",
    size = 8 / .pt, fontface = "bold", color = "#1046b1", nudge_x = 1.25
  ) +
  geom_segment(
    x = 76, xend = 86, y = "Francis", yend = "Francis",
    linewidth = 1, linejoin = "mitre", color = "#ff505b",
    arrow = arrow(angle = 30, length = unit(0.15, "cm"), type = "closed")
  ) +
  geom_text(
    x = 74.5, y = "Francis", label = "76",
    family = "karla",
    size = 9 / .pt, fontface = "bold", color = "#ff505b"
  ) +

  # Labels
  labs(
    title = "Pope longevity II",
    subtitle = "Age spans of popes with the longest tenures",
    caption = "Source: \"List of popes\" Wikipedia article"
  ) +
  scale_x_continuous(breaks = seq(30, 90, 10)) +
  theme_minimal(base_family = "karla") +
  theme(
    plot.title = element_text(size = 16, face = "bold", hjust = .5),
    plot.subtitle = element_text(size = 14, hjust = .5, margin = margin(b = 12)),
    plot.caption = element_text(size = 8, hjust = 0, margin = margin(t = 10)),
    axis.ticks = element_blank(),
    axis.title = element_blank(),
    axis.text.x = element_text(size = 12, margin = margin(t = 5)),
    axis.text.y = element_text(
      size = c(rep(11, 14), 12) %>% rev(),
      face = c(rep("plain", 13), "bold") %>% rev(),
      color = c(rep("gray10", 13), "#ff505b") %>% rev(),
      margin = margin(r = 5)
    ),
    panel.background = element_rect(fill = "gray97", color = NA),
    panel.grid.major.x = element_line(linewidth = .15, color = "gray80"),
    panel.grid.major.y = element_blank(),
    panel.grid.minor.x = element_blank(),
    panel.grid.minor.y = element_blank()
  )

We can use a bit of survival analysis to estimate the probability of a pope making it to their 20th year, controlled for whether they started relatively young (below 60 years old) or relatively old (60 and above). The Kaplan-Meier estimates are computed using the survival package and plotted using the ggsurvfit package.

Code
library(survival)
library(ggsurvfit)

popes1 <- popes %>%
  mutate(old = case_when(
    age_start < 60 ~ 0,
    age_start >= 60 ~ 1
  ))

survfit2(with(popes1, Surv(tenure)) ~ old, data = popes1) %>%
  ggsurvfit(linewidth = .75) +
  add_confidence_interval() +
  geom_vline(xintercept = 10, linetype = "dashed", linewidth = .25) +

  # Labels
  labs(
    title = "Pope longevity III",
    subtitle = "Survival probability of popes by starting age",
    caption = "Source: \"List of popes\" Wikipedia article"
  ) +
  scale_x_continuous(name = "Years of tenure") +
  scale_y_continuous(
    name = "Probability of still being pope",
    labels = scales::percent
  ) +
  scale_color_manual(
    labels = c("Under 60", "60 and above"),
    values = c("#ffa600", "#1046b1")
  ) +
  scale_fill_manual(values = c("#FFD079", "#9BB8F6")) +
  guides(fill = FALSE) +

  theme_minimal(base_family = "karla") +
  theme(
    plot.title = element_text(size = 16, face = "bold", hjust = .5),
    plot.subtitle = element_text(size = 14, hjust = .5, margin = margin(b = 12)),
    plot.caption = element_text(size = 8, hjust = 0, margin = margin(t = 10)),
    axis.ticks = element_blank(),
    axis.title.x = element_text(size = 12, margin = margin(t = 5)),
    axis.title.y = element_text(size = 12, margin = margin(r = 5)),
    axis.text.x = element_text(size = 11, margin = margin(t = 5)),
    axis.text.y = element_text(size = 11, margin = margin(r = 5)),
    legend.position = c(.75, .9),
    legend.direction = "horizontal",
    legend.text = element_text(size = 12),
    panel.background = element_rect(fill = "gray97", color = NA),
    panel.grid.major.x = element_blank(),
    panel.grid.major.y = element_blank(),
    panel.grid.minor.x = element_blank(),
    panel.grid.minor.y = element_blank()
  )

Based on these estimates, the young group has a 33.1% probability of reaching their 10th year while the old group has only a 23.9% probability. On the other hand, the young group has a 6.3% probability of reaching their 20th year while the old group has a 2.3% chance. It should be noted though that the estimates for the old group have a high amount of uncertainty, mainly because few old popes make it to their 20th year.

If Francis completes his second decade as pope, he would be 96. The odds are against him, but it wouldn’t be unheard of. Pope Agatho, elected pope in 678 AD at the age of 100, reigned until his death at age 103.

Data

Footnotes

  1. Although Benedict XVI lived to 95, he resigned the papacy when he was 85.↩︎

Reuse