I’m starting to think there might be privileges to being old, white, and male
R
ggplot
Published
March 3, 2023
In a previous post, we talked about the Oscars and whether prestige awards still matter. Let’s turn now to what is perhaps the mother of all prestige awards — the Nobel Prize. The legacy of Swedish industrialist Alfred Nobel, it honors outstanding achievement in the fields of chemistry, literature, medicine, peace, physics, and, since 1969, economics. Winners — ahem, laureates — receive unparalleled stature not just in their fields but in the public sphere (deservedly or otherwise).
In its 120-year history, close to a thousand individuals (and some two dozen organizations) have been given a Nobel. What are they like? As an elite group, you can probably guess that they would tend towards oldness, whiteness, and maleness. But how old, how white, and how male? Fortunately, NobelPrize.org has an API for downloading data on all laureates, through which I was able to compile, for each laureate: the year and category they won in, their sex, their birth date, and their birth country (using modern borders). I won’t be including organizations in my analysis.
Let’s take a look at the cleaned dataset using reactable, a wonderful table-making package by Greg Lin that I sure wish I discovered earlier. Below is a sortable, searchable, paginated table of the complete dataset:
Of the three attributes, being old is probably the most innocent. A Nobel Prize after all generally honors a body of work, and so is received late in one’s career. Below is a tabulation of laureate age ranges by prize category.
The youngest laureate was for Peace — Malala Yousafzai from Pakistan. Peace is unusual among the Nobel prizes: while it is also awarded for a body of work, it can get quite topical, awarding very recent achievements. Barack Obama was just eight months into his presidency when he was awarded for “extraordinary efforts to strengthen international diplomacy and cooperation between peoples”. This willingness to jump the gun has led to some deeply awkward conferrals, most recently Ethiopian prime minister Abiy Ahmed, who started a war against his own people less than a year after bagging the prize.
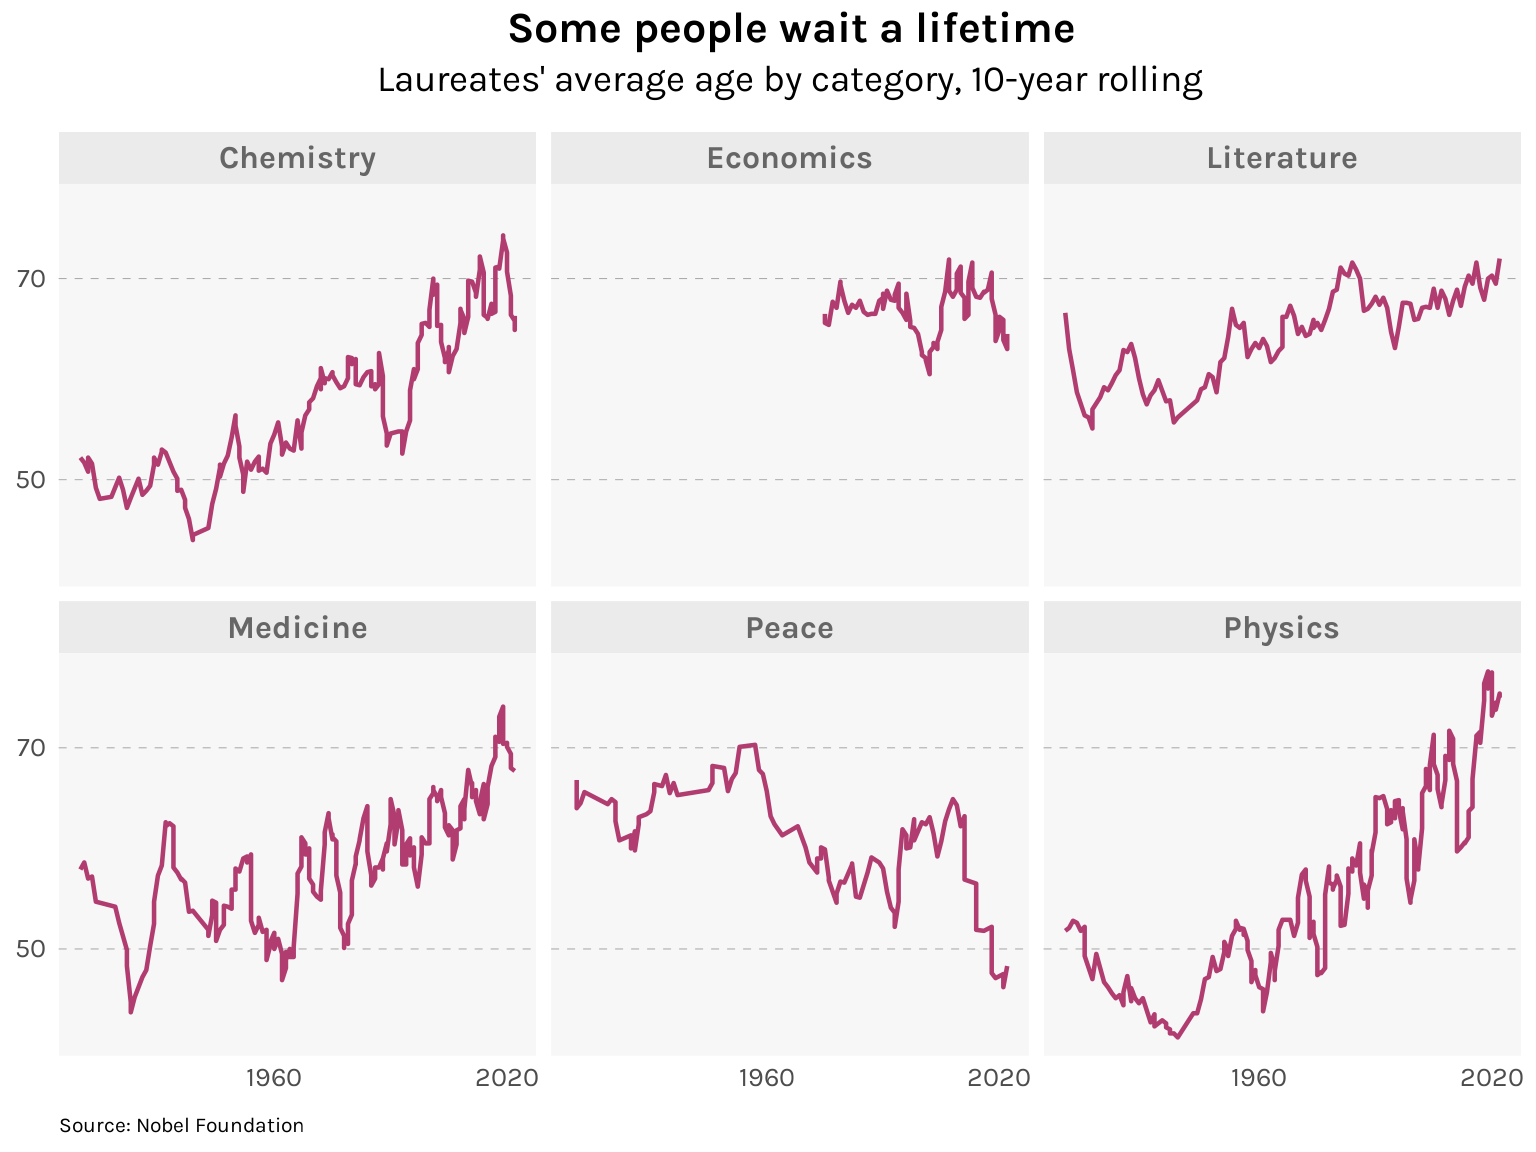
What might be more surprising in the table above is the youngest age among the Physics laureates. Someone under 40 winning a Nobel in the sciences fields (or even in Literature) is unheard of today, but it was more common during the heyday of theoretical physics in the early twentieth century, when discoveries in quantum mechanics were being made left and right.1 Indeed, the changing nature of scientific research can be seen in the chart below, which plots the average ages of laureates over time.
Code
library(zoo)library(ggplot2)nobel %>%group_by(category) %>%mutate(agemean_ra =rollmean(age, k =10, fill =NA, align ="right", na.rm =TRUE)) %>%ungroup() %>%ggplot(aes(x = year, y = agemean_ra)) +geom_line(linewidth = .8, color ="#b13d70") +facet_wrap(~category, nrow =2, scales ="fixed") +labs(title ="Some people wait a lifetime",subtitle ="Laureates' average age by category, 10-year rolling",caption ="Source: Nobel Foundation" ) +scale_x_continuous(limits =c(1910, 2022), breaks =c(1960, 2020)) +scale_y_continuous(breaks =c(50, 70)) +theme(text =element_text(family ="karla"),axis.title =element_blank(),axis.ticks =element_blank(),axis.text =element_text(size =10),panel.background =element_rect(fill ="gray97", color =NA),panel.grid.major.x =element_blank(),panel.grid.major.y =element_line(linewidth = .15, linetype ="dashed", color ="gray60"),panel.grid.minor.x =element_blank(),panel.grid.minor.y =element_blank(),plot.title =element_text(size =16, face ="bold", hjust = .5),plot.subtitle =element_text(size =14, hjust = .5, margin =margin(b =12)),plot.caption =element_text(size =8, hjust =0, margin =margin(t =10)),strip.background =element_rect(fill ="gray92", color =NA),strip.text =element_text(size =12, face ="bold", color ="gray40") )
Laureates in the sciences fields have been getting older. According to a curator at the Nobel Museum, this is partly a crowding effect: whereas 1,000 physicists were competing for the prize 100 years ago, today there are a million. With the Nobel only awarding up to three for a given category each year, would-be laureates need to wait longer for their turn.
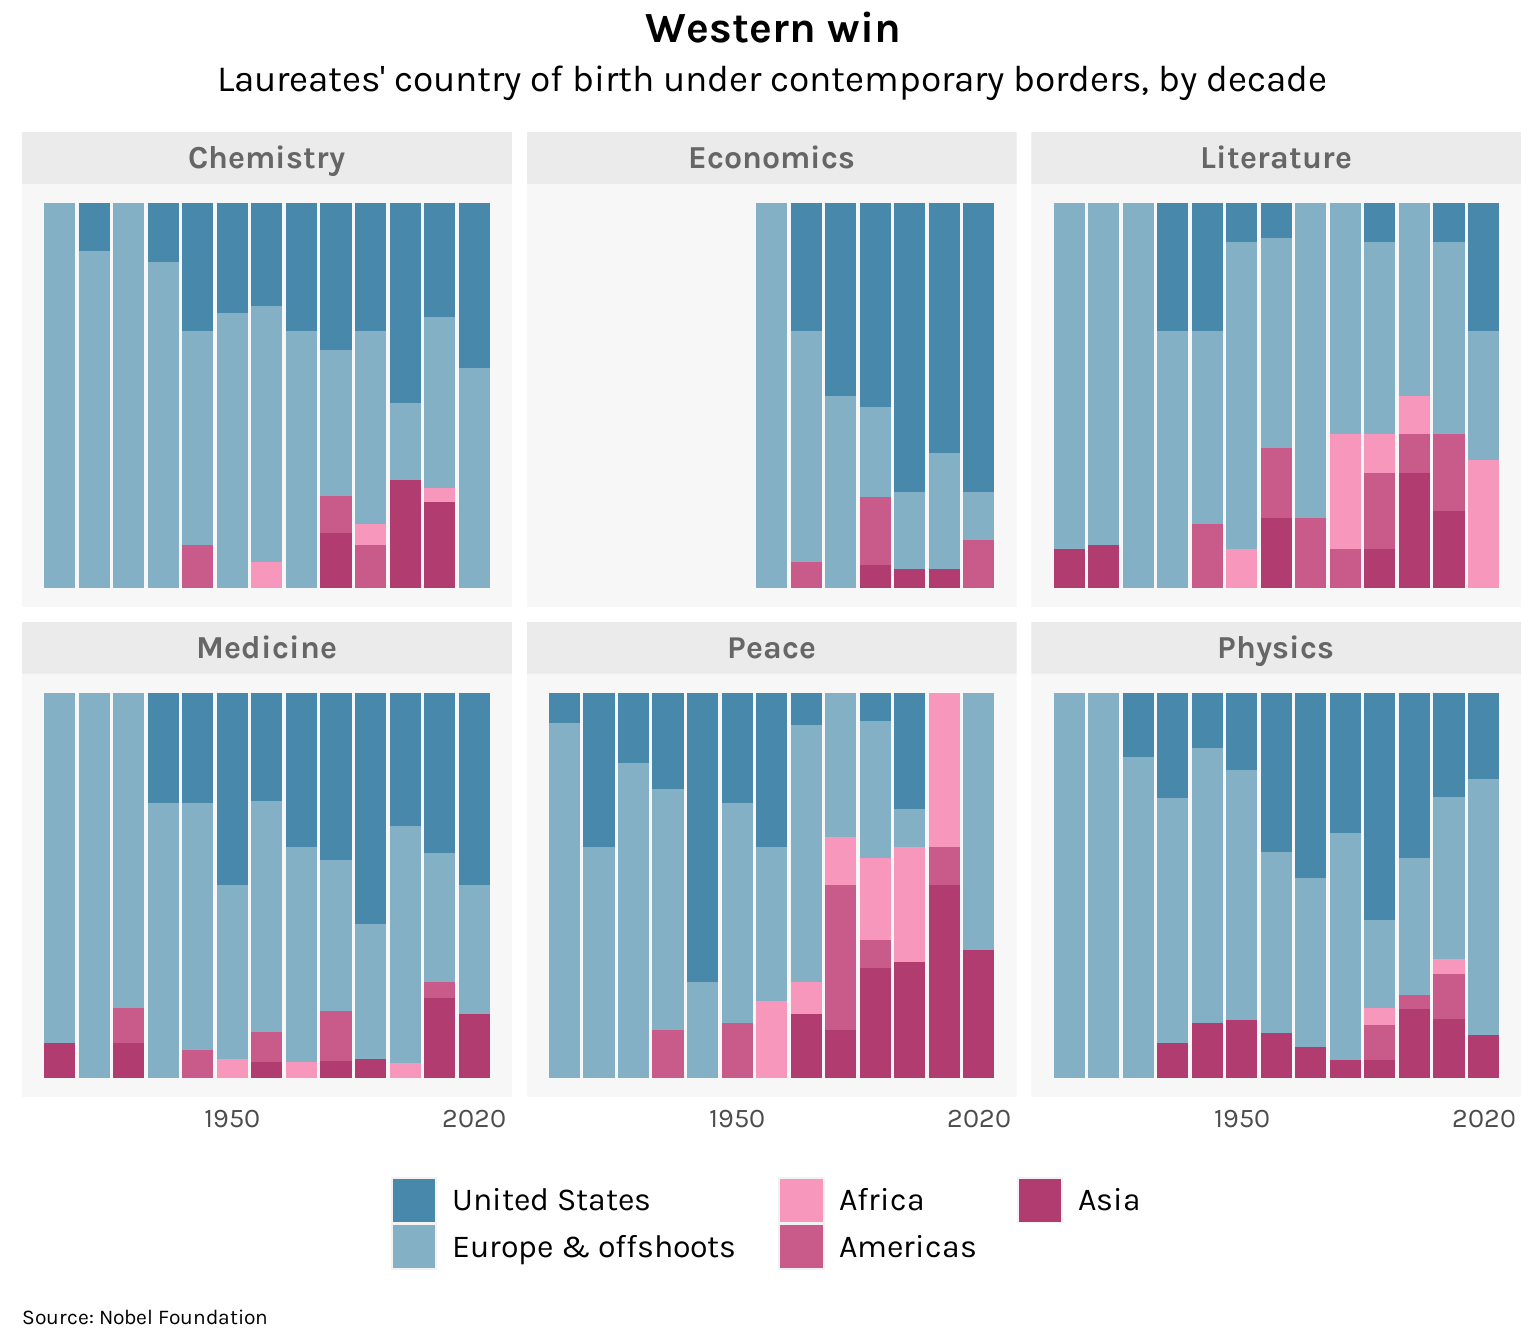
It will likely get more crowded still. Achievements in science and literature are driven not just by personal genius but also by an enabling environment that nurtures that genius, itself a function of economic wealth. No wonder then that the richest countries — the United States, Europe, and European offshoots (Australia, Canada, New Zealand) — dominate the Nobel Prizes. This should change as developing countries catch up and begin investing more heavily in their scientists and artists.
Code
nobel %>%mutate(group =case_when( birth_continent =="Europe"~"Europe & offshoots", birth_country =="USA"~"United States", birth_continent =="North America"~"Americas", birth_continent =="South America"~"Americas", birth_country =="Canada"~"Europe & offshoots", birth_country =="Australia"~"Europe & offshoots", birth_country =="New Zealand"~"Europe & offshoots", birth_country =="East Timor"~"Asia",TRUE~ birth_continent ),group =factor( group, levels =c("United States","Europe & offshoots","Africa","Americas","Asia" )),decade = plyr::round_any(year, 10, floor) ) %>%group_by(decade, category) %>%count(group) %>%ungroup() %>%ggplot(aes(x = decade, y = n, fill = group)) +geom_bar(position ="fill", stat ="identity", color =NA) +facet_wrap(~category, nrow =2, scales ="fixed") +labs(title ="Western win",subtitle ="Laureates' country of birth under contemporary borders, by decade",caption ="Source: Nobel Foundation" ) +scale_x_continuous(breaks =c(1950, 2020)) +scale_fill_manual(name ="",values =c("#4889ab", "#84b0c5", "#f697bb", "#c85b89", "#b13d70") ) +guides(fill =guide_legend(nrow =2)) +theme(text =element_text(family ="karla"),axis.title =element_blank(),axis.ticks =element_blank(),axis.text.x =element_text(size =10, hjust = .5),axis.text.y =element_blank(),legend.position ="bottom",legend.text =element_text(size =12, margin =margin(r =10)),panel.background =element_rect(fill ="gray97", color =NA),panel.grid =element_blank(),plot.title =element_text(size =16, face ="bold", hjust = .5),plot.subtitle =element_text(size =14, hjust = .5, margin =margin(b =12)),plot.caption =element_text(size =8, hjust =0, margin =margin(t =10)),strip.background =element_rect(fill ="gray92", color =NA),strip.text =element_text(size =12, face ="bold", color ="gray40") )
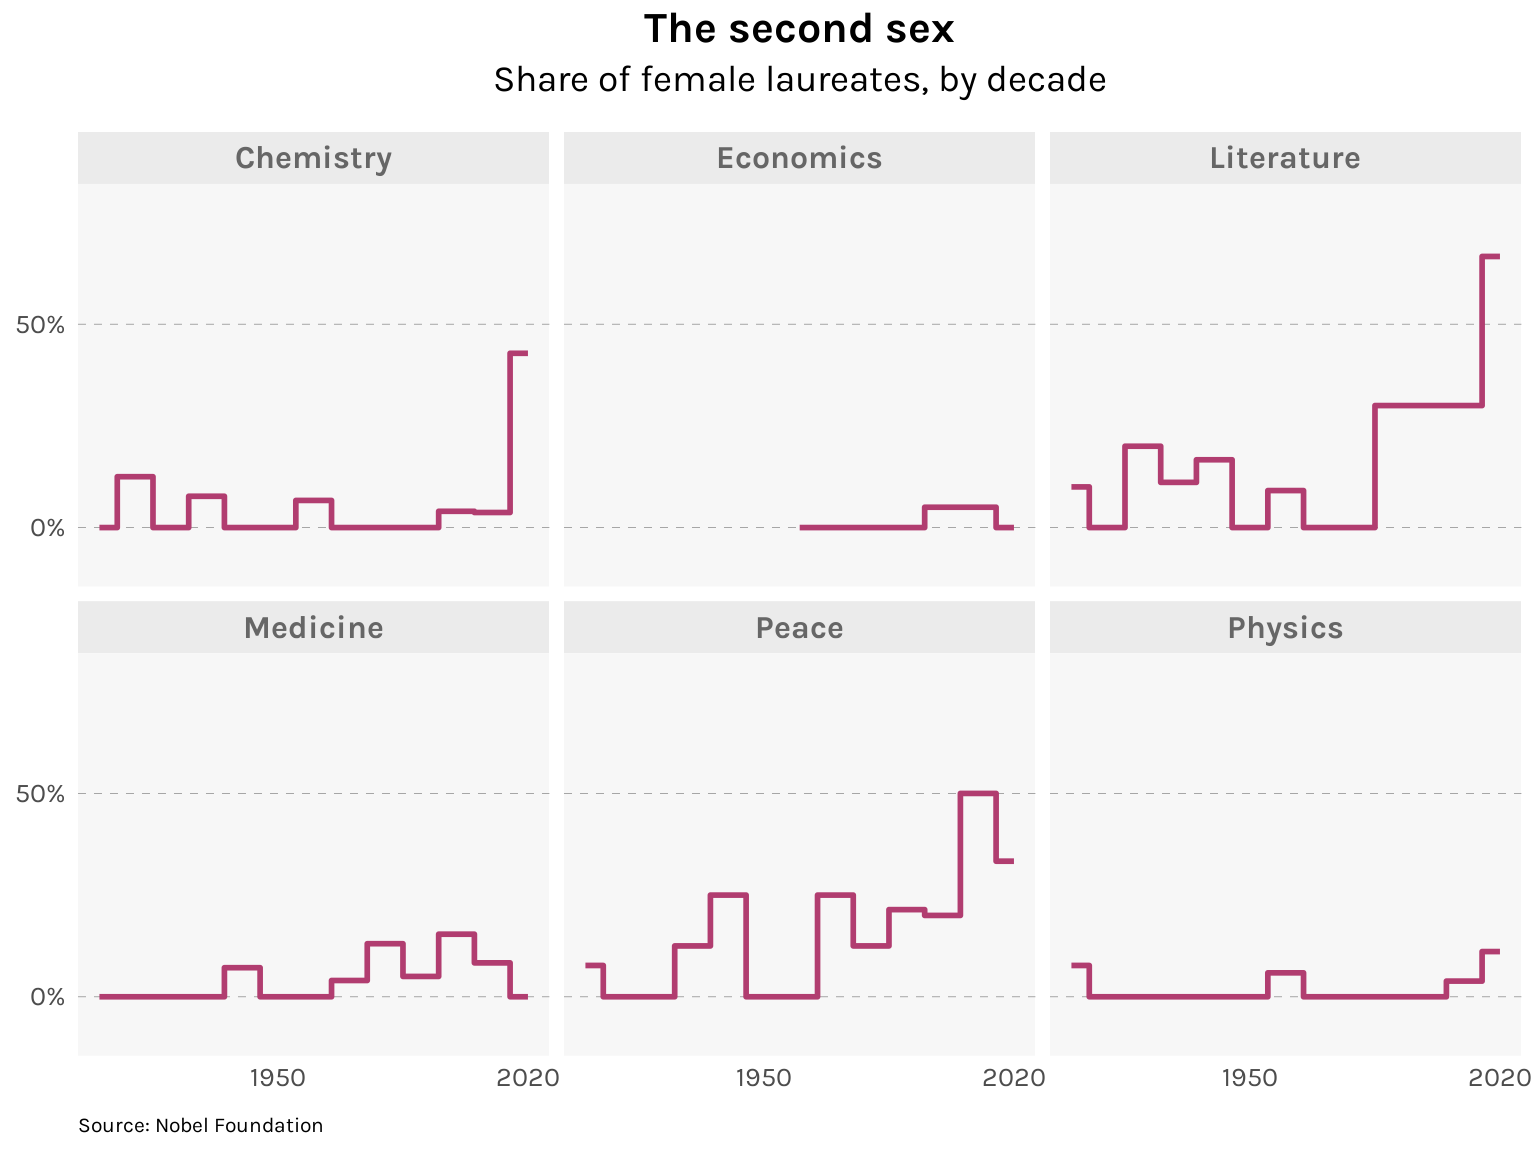
Likewise, the greater participation of women in STEM fields should hopefully go some ways in bridging the sex gap among laureates. My field of economics has a particularly atrocious record, with just two female laureates (Elinor Ostrom and Esther Duflo) in 54 years.2 Literature has made the most progress here, though women still only won one-third of the prizes since 2000.
Code
nobel %>%mutate(decade = plyr::round_any(year, 10, floor)) %>%drop_na(sex) %>%group_by(decade, category) %>%count(sex) %>%mutate(share = n /sum(n)) %>%ungroup() %>%complete(decade, category, sex, fill =list(n =0, share =0)) %>%filter(sex =="female"&!(category =="Economics"& decade <1960)) %>%ggplot(aes(x = decade, y = share)) +geom_step(direction ="mid", linewidth =1, color ="#b13d70") +facet_wrap(~category, nrow =2, scales ="fixed") +labs(title ="The second sex",subtitle ="Share of female laureates, by decade",caption ="Source: Nobel Foundation" ) +scale_x_continuous(breaks =c(1950, 2020)) +scale_y_continuous(limits =c(-.1, .8), breaks =c(0, .5), labels = scales::label_percent()) +theme(text =element_text(family ="karla"),axis.title =element_blank(),axis.ticks =element_blank(),axis.text =element_text(size =10),legend.position ="bottom",legend.text =element_text(size =12, margin =margin(r =10)),panel.background =element_rect(fill ="gray97", color =NA),panel.grid.major.x =element_blank(),panel.grid.major.y =element_line(linewidth = .15, linetype ="dashed", color ="gray60"),panel.grid.minor.x =element_blank(),panel.grid.minor.y =element_blank(),plot.title =element_text(size =16, face ="bold", hjust = .5),plot.subtitle =element_text(size =14, hjust = .5, margin =margin(b =12)),plot.caption =element_text(size =8, hjust =0, margin =margin(t =10)),strip.background =element_rect(fill ="gray92", color =NA),strip.text =element_text(size =12, face ="bold", color ="gray40") )
Beyond problems of representation in the arts and sciences, another major issue is the composition of the prize selection committees themselves. These comprise just a handful of elite Swedes and Norwegians, and though they ostensibly solicit nominations from thousands of outside experts and institutions, theirs is the final say, in deliberations that are kept secret for 50 years. And insularity may not even be their biggest problem: a sexual assault scandal in 2017 hinted at moral bankruptcy within the Swedish Academy, which decides the Literature Prize.
No doubt the Nobel Prizes are held in high reverence around the world, but I suspect it has more to do with the distinction of the men and women who have received them in the past than the esteem held for the judgment of a few elite Scandinavians. As a hilarious corrective to Nobel worship, let’s turn to Bob Dylan, winner of the 2016 Literature Prize, who seenzoned the Swedish Academy, didn’t bother to attend the ceremony, and cribbed off SparkNotes for his Nobel lecture. I know Dylan was a controversial choice, but look: anyone who accepts a Nobel in a hoodie deserves ten of them.
Key winners under 40 include Werner Heisenberg (31), Paul Dirac (31), Enrico Fermi (37), and Niels Bohr (37). This period in physics is covered in one of my favorite books, The Making of the Atomic Bomb by Richard Rhodes.↩︎
A 2019 symposium by the American Economic Association on “Women in Economics” has three interesting papers on the topic. But speaking to economics’ legendary tone-deafness, it was followed by a symposium on “The Problems of Men”.↩︎