Learning curves

Charts have been aiding — and confusing — students of economics for generations. Give them a fresh twist by adding interactivity.

D3/OJS
Published

April 14, 2023

Economics is a strange field, a social science with pretensions of a natural science that manages to annoy both. I have been its student and its teacher and I can tell you that it’s weird inside and out. Many a night have I spent working through the mathematics of a world where people are immortal and shops sell 0.000001 of anything. Yet for all its peculiarities, I do think everyone can profit from a little economic knowledge. Economics, to me, is about clarifying trade-offs given a set of goals and rules over how the world works. Notice that this definition doesn’t actually include the economy (over which economics courses dwell astonishingly little!) but focuses rather on an economic way of thinking. Econ 101 may not teach you much about stocks, taxes, or running a business, but it does train you to tackle problems methodically, systematically.

Anyone who’s taken an undergraduate economics course knows that the subject is taught mainly through charts. From my experience, these are both the boon and bane of the would-be student. Charts are great — we here at Two Points Make a Line are big fans — but working through them can be challenging. The problem is that students typically see charts as frozen images, whereas their power is in visualizing the interrelations among variables in a dynamic sense. Whenever charts are discussed, there is always talk of moving along the curve, or shifting the curve, or pivoting the curve. Students are expected to hallucinate movement where there is none.

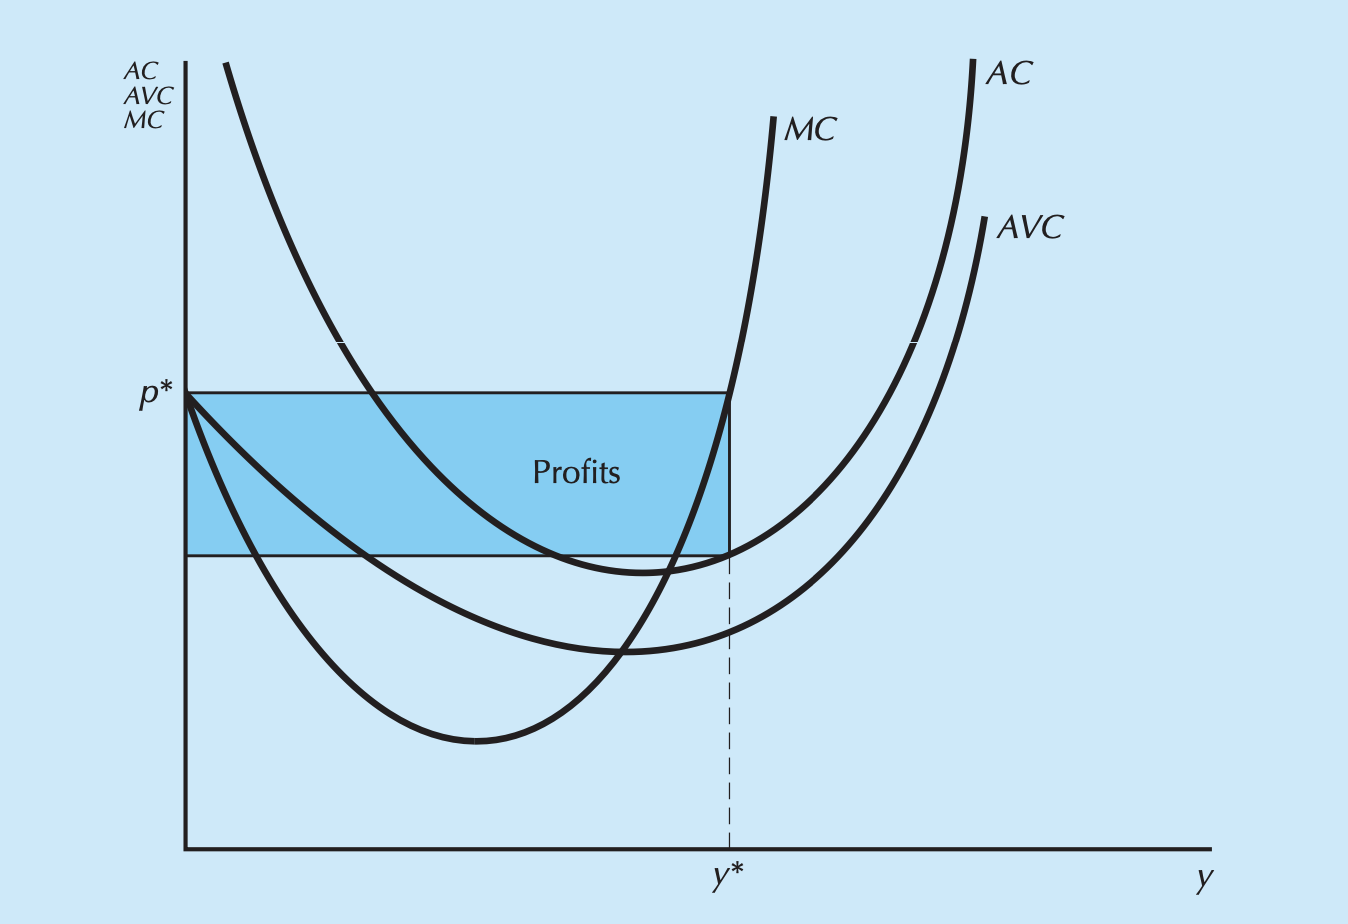
Take this cost curve diagram from Hal Varian’s popular microeconomics textbook.

Cost curves from Hal Varian’s Intermediate Microeconomics (8th ed., p. 404)

Nevermind for now what it means; suppose I simply asked you to imagine how the shaded rectangle would change if you moved \(p^*\) down, moved \(y^*\) to the left, and shifted the AC curve up. Too easy? Now reverse that and compare the two pictures. Such exercises quickly become a headache. And this neat textbook chart is the best-case scenario too: many have to make do with the hand-drawn, Basquiat-looking diagrams their professors etch on the blackboard.

Given that more and more students are consuming their learning materials digitally, it is opportune to embrace interactivity in economics diagrams. By this I mean charts that the student can actually manipulate in a guided setting, shifting mental resources away from hallucinating movement and towards understanding the concepts conveyed. This blog post serves as something of a proof-of-concept for how an interactive module can be done. I’ll be covering cost curves, one of the major stumbling blocks in an Econ 101 course.

Firm foundations

Economists model the economy as having two types of entities: households and firms. Households maximize their utility by buying goods and services from firms, with money they earn by working for firms. Firms maximize profits by buying inputs from households, turning them into goods and services, and then selling them back to households.

Let’s zoom in on a firm in a particular market. Its behavior proceeds in two steps. First, it looks at its technological capabilities and decides on the best (i.e. cheapest) mix of inputs to purchase for every possible level of output. This results in a cost function \(C(q)\), which gives the costs associated with producting \(q\) units of output. Armed with this, it moves on to the second step, where it decides on the level of output that maximizes its profits.

We’ll skip the first step here and assume the firm has already derived its cost function. It would typically be something of the following form:

\[ \text{Cost}(q, \text{FixedCosts}) = aq^3 - bq^2 + cq + \text{FixedCosts} \]

You don’t have to worry so much about the math, but pay attention to the fact that total cost is composed of a fixed cost (does not change with \(q\)) and a variable cost (varies with \(q\)). This cost function is plotted below.

Code
viewof q0 = Inputs.range([0, qMax], { label: "Output", step: 1, value: 50 })
viewof fc0 = Inputs.range([0, fcMax], { label: "Fixed cost", step: 1, value: 250 })

{
  const params = ({ q: null, fc: null, p: null, c: null });
  params.q = q0;
  params.fc = fc0;
  const id = d3.randomInt(100000, 1000000)();
  const axisTitles = ({ x: "Output", y: "$" });
  
  const yScaler = d3.scaleLinear()
    .domain([0, costFxn({ q: qMax, fc: fcMax })])
    .range([panelHeight, 0]);
  
  const container = d3.create("div")
        .attr("style", "display: flex; justify-content: center");
        
  const svg = container.append("svg")
    .attr("width", width + margin.left + margin.right)
    .attr("height", panelHeight + margin.top + margin.bottom)
    .attr("viewBox", [0, 0, width + margin.left + margin.right, panelHeight + margin.top + margin.bottom])
    .attr("style", "max-width: 100%; height: auto; height: intrinsic;")
    .call(background)
    .call(labelsToggle, id);
  
  const panel = svg.append("g")
    .attr("transform", `translate(${margin.left}, ${margin.top})`)
  
  panel.append("g")
    .call(clipWide, id)
    .call(addCurve, id, cost, params, yScaler)
    .call(yGuide, cost, params, yScaler);
  
  panel.append("g")
    .call(panelAxes, axisTitles)
    .call(xGuides, cost, params, yScaler, 1);
  
  panel.append("g")
    .attr("id", `labels-${id}`)
    .call(clipWide, id)
    .call(addLabel, "Cost", xScaler(85) + 10, yScaler(costFxn({ q: 85, fc: params.fc })) + 10);
   
  // Toggle event listener ////////////////////////////////////////////////////////////////////////
  
  const cb = svg.select("foreignObject").select(`input#checkbox-${id}`)
  
  cb.on("click", () => {
    const isChecked = cb.property("checked");
    const chartLabels = svg.selectAll(`g#labels-${id}`);
    isChecked ? chartLabels.style("visibility", "visible") : chartLabels.style("visibility", "hidden");
  });
  
  return container.node();
}
html`<div class="ojs-caption">The checkbox at the corner toggles whether labels are visible, a feature that will be useful later as our charts get more crowded. You can always hover over a curve to see its name.</div>`

Notice that the cost curve has a vague S shape. This captures the idea that at a small enough scale, costs don’t rise all that quickly with output. Imagine you started a food truck business. Your initial outlays for the truck, the stove, the ingredients, and so on will comprise the bulk of your total costs, and any extra burger, taco, or kebab you produce won’t raise this by a lot. As you expand however, you start hitting the limits of your capacity and each extra unit of output becomes more and more expensive to produce. Thus we see the cost curve growing steeper and steeper.

Play around with the sliders to see how changing output and fixed costs changes the chart. Observe that as long as there are fixed costs, we can never bring total costs down to zero, even with zero output. Also observe that raising fixed costs shifts the whole curve up, so that costs are higher for all levels of output. In the long run, fixed costs approach zero since all inputs can be varied given a long enough time frame.

Our goal as the firm is to figure out what the optimal level of output is from a profit-maximizing standpoint. To do this, we’ll need to look at things from a per unit perspective. The charts below introduce three useful curves: the average cost curve, the average variable cost curve, and the marginal cost curve.

Code
viewof q1 = Inputs.range([0, qMax], { label: "Output", step: 1, value: 50 })
viewof fc1 = Inputs.range([0, fcMax], { label: "Fixed cost", step: 1, value: 250 })
Code
{
  const params = ({ q: null, fc: null, p: null, c: null });
  params.q = q1;
  params.fc = fc1;
  const id = d3.randomInt(100000, 1000000)();
  const axisTitlesTop = ({ x: "Output", y: "$" });
  const axisTitlesBottom = ({ x: "Output", y: "$/unit" });
  
  const yScalerTop = d3.scaleLinear()
    .domain([0, costFxn({ q: qMax, fc: fcMax })])
    .range([panelHeight, 0]);
    
  const yScalerBottom = d3.scaleLinear()
    .domain([0, acFxn({ q: qMax, fc: fcMax })])
    .range([panelHeight, 0]);
  
  const container = d3.create("div")
        .attr("style", "display: flex; justify-content: center");
        
  const svg = container.append("svg")
    .attr("width", width + margin.left + margin.right)
    .attr("height", height + margin.top + margin.bottom)
    .attr("viewBox", [0, 0, width + margin.left + margin.right, height + margin.top + margin.bottom])
    .attr("style", "max-width: 100%; height: auto; height: intrinsic;")
    .call(background)
    .call(labelsToggle, id);
  
  // Top panel ////////////////////////////////////////////////////////////////////////////////////
  
  const panelTop = svg.append("g")
    .attr("transform", `translate(${margin.left}, ${margin.top})`);
  
  panelTop.append("g")
    .call(clipWide, id)
    .call(addCurve, id, cost, params, yScalerTop)
    .call(yGuide, cost, params, yScalerTop);
  
  panelTop.append("g")
    .call(panelAxes, axisTitlesTop)
    .call(xGuides, cost, params, yScalerTop);
  
  panelTop.append("g")
    .attr("id", `labels-${id}`)
    .call(clipWide, id)
    .call(addLabel, "Cost", xScaler(85) + 10, yScalerTop(costFxn({ q: 85, fc: params.fc })) + 10);
    
  // Bottom panel /////////////////////////////////////////////////////////////////////////////////
  
  const panelBottom = svg.append("g")
    .attr("transform", `translate(${margin.left}, ${margin.top + panelHeight + margin.between})`);
  
  panelBottom.append("g")
    .call(clip, id)
    .call(addCurve, id, ac, params, yScalerBottom)
    
  panelBottom.append("g")
    .call(clipWide, id)
    .call(yGuide, ac, params, yScalerBottom);
  
  panelBottom.append("g")
    .call(panelAxes, axisTitlesBottom);
  
  panelBottom.append("g")
    .attr("id", `labels-${id}`)
    .call(addLabel, "AC", xScaler(95) - 10, yScalerBottom(acFxn({ q: 95, fc: params.fc })) - 10, "end");
  
  // Toggle event listener ////////////////////////////////////////////////////////////////////////
  
  const cb = svg.select("foreignObject").select(`input#checkbox-${id}`);
  
  cb.on("click", () => {
    const isChecked = cb.property("checked");
    const chartLabels = svg.selectAll(`g#labels-${id}`);
    isChecked ? chartLabels.style("visibility", "visible") : chartLabels.style("visibility", "hidden");
  });
  
  return container.node();
}
Code
{
  const params = ({ q: null, fc: null, p: null, c: null });
  params.q = q1;
  params.fc = fc1;
  const id = d3.randomInt(100000, 1000000)();
  const axisTitlesTop = ({ x: "Output", y: "$" });
  const axisTitlesBottom = ({ x: "Output", y: "$/unit" });
  
  const yScalerTop = d3.scaleLinear()
    .domain([0, costFxn({ q: qMax, fc: fcMax })])
    .range([panelHeight, 0]);
    
  const yScalerBottom = d3.scaleLinear()
    .domain([0, acFxn({ q: qMax, fc: fcMax })])
    .range([panelHeight, 0]);
  
  const container = d3.create("div")
        .attr("style", "display: flex; justify-content: center");
        
  const svg = container.append("svg")
    .attr("width", width + margin.left + margin.right)
    .attr("height", height + margin.top + margin.bottom)
    .attr("viewBox", [0, 0, width + margin.left + margin.right, height + margin.top + margin.bottom])
    .attr("style", "max-width: 100%; height: auto; height: intrinsic;")
    .call(background)
    .call(labelsToggle, id);
    
  // Top panel ////////////////////////////////////////////////////////////////////////////////////
  
  const panelTop = svg.append("g")
    .attr("transform", `translate(${margin.left}, ${margin.top})`);
  
  panelTop.append("g")
    .call(clipWide, id)
    .call(addCurve, id, cost, params, yScalerTop)
    .call(yGuide, cost, params, yScalerTop);
  
  panelTop.append("g")
    .call(panelAxes, axisTitlesTop)
    .call(xGuides, cost, params, yScalerTop);
  
  panelTop.append("g")
    .attr("id", `labels-${id}`)
    .call(clipWide, id)
    .call(addLabel, "Cost", xScaler(85) + 10, yScalerTop(costFxn({ q: 85, fc: params.fc })) + 10);
    
  // Bottom panel /////////////////////////////////////////////////////////////////////////////////
  
  const panelBottom = svg.append("g")
    .attr("transform", `translate(${margin.left}, ${margin.top + panelHeight + margin.between})`);
  
  panelBottom.append("g")
    .call(clip, id)
    .call(addCurveFull, id, ac, params, yScalerBottom, gray)
    .call(addCurve, id, avc, params, yScalerBottom)
  
  panelBottom.append("g")
    .call(clipWide, id)
    .call(yGuide, avc, params, yScalerBottom);
  
  panelBottom.append("g")
    .call(panelAxes, axisTitlesBottom);
    
  panelBottom.append("g")
    .attr("id", `labels-${id}`)
    .call(addLabel, "AC", xScaler(95) - 10, yScalerBottom(acFxn({ q: 95, fc: params.fc })) - 10, "end")
    .call(addLabel, "AVC", xScaler(95) + 10, yScalerBottom(avcFxn({ q: 95 })) + 10);
  
  // Toggle event listener ////////////////////////////////////////////////////////////////////////
  
  const cb = svg.select("foreignObject").select(`input#checkbox-${id}`);
  
  cb.on("click", () => {
    const isChecked = cb.property("checked");
    const chartLabels = svg.selectAll(`g#labels-${id}`);
    isChecked ? chartLabels.style("visibility", "visible") : chartLabels.style("visibility", "hidden");
  });
  return container.node();
}
Code
{
  const params = ({ q: null, fc: null, p: null, c: null });
  params.q = q1;
  params.fc = fc1;
  const id = d3.randomInt(100000, 1000000)();
  const axisTitlesTop = ({ x: "Output", y: "$" });
  const axisTitlesBottom = ({ x: "Output", y: "$/unit" });
  
  const yScalerTop = d3.scaleLinear()
    .domain([0, costFxn({ q: qMax, fc: fcMax })])
    .range([panelHeight, 0]);
    
  const yScalerBottom = d3.scaleLinear()
    .domain([0, acFxn({ q: qMax, fc: fcMax })])
    .range([panelHeight, 0]);
  
  const container = d3.create("div")
        .attr("style", "display: flex; justify-content: center");
        
  const svg = container.append("svg")
    .attr("width", width + margin.left + margin.right)
    .attr("height", height + margin.top + margin.bottom)
    .attr("viewBox", [0, 0, width + margin.left + margin.right, height + margin.top + margin.bottom])
    .attr("style", "max-width: 100%; height: auto; height: intrinsic;")
    .call(background)
    .call(labelsToggle, id);
    
  // Top panel ////////////////////////////////////////////////////////////////////////////////////
  
  const panelTop = svg.append("g")
    .attr("transform", `translate(${margin.left}, ${margin.top})`);
  
  panelTop.append("g")
    .call(clipWide, id)
    .call(addCurve, id, cost, params, yScalerTop)
    .call(yGuide, cost, params, yScalerTop);
  
  panelTop.append("g")
    .call(panelAxes, axisTitlesTop)
    .call(xGuides, cost, params, yScalerTop);
    
  panelTop.append("g")
    .attr("id", `labels-${id}`)
    .call(clipWide, id)
    .call(addLabel, "Cost", xScaler(85) + 10, yScalerTop(costFxn({ q: 85, fc: params.fc })) + 10);
    
  // Bottom panel /////////////////////////////////////////////////////////////////////////////////
  
  const panelBottom = svg.append("g")
    .attr("transform", `translate(${margin.left}, ${margin.top + panelHeight + margin.between})`);
  
  panelBottom.append("g")
    .call(clip, id)
    .call(addCurveFull, id, ac, params, yScalerBottom, gray)
    .call(addCurveFull, id, avc, params, yScalerBottom, gray)
    .call(addCurve, id, mc, params, yScalerBottom)
  
  panelBottom.append("g")
    .call(clipWide, id)
    .call(yGuide, mc, params, yScalerBottom);
  
  panelBottom.append("g")
    .call(panelAxes, axisTitlesBottom);
  
  panelBottom.append("g")
    .attr("id", `labels-${id}`)
    .call(addLabel, "AC", xScaler(95) - 10, yScalerBottom(acFxn({ q: 95, fc: params.fc })) - 10, "end")
    .call(addLabel, "AVC", xScaler(95) + 10, yScalerBottom(avcFxn({ q: 95 })) + 10)
    .call(addLabel, "MC", xScaler(63) + 10, yScalerBottom(mcFxn({ q: 63 })) + 10);
    
  // Toggle event listener ////////////////////////////////////////////////////////////////////////
  
  const cb = svg.select("foreignObject").select(`input#checkbox-${id}`);
  
  cb.on("click", () => {
    const isChecked = cb.property("checked");
    const chartLabels = svg.selectAll(`g#labels-${id}`);
    isChecked ? chartLabels.style("visibility", "visible") : chartLabels.style("visibility", "hidden");
  });
  
  return container.node();
}

The average cost or AC curve simply plots total costs divided by output. It is U-shaped, shooting up at both very low and very high output levels. In fact, in the presence of fixed costs, AC goes to infinity as output approaches zero. Notice that this no longer happens if we set fixed costs to zero.

The second panel plots the average variable cost or AVC curve. This is just the AC curve minus the fixed costs component. The AVC curve is also U-shaped, but it doesn’t shoot to infinity when output is zero. As output gets larger and larger, the share of fixed costs in total costs gets smaller and smaller; thus we see the AC and AVC curves converging. Setting fixed costs to zero merges the AC and AVC curves, which is to say, the AC and AVC curves are only distinct quantities in the short run.

The marginal cost or MC curve is on the third panel. Of the three, it is probably the trickiest to grasp, but as marginalist reasoning abounds in economics, it’s worthwhile to really think it through. The MC curve plots the incremental change in total cost given one additional unit of output. It is not an average quantity. It is also U-shaped, but it is a much thinner U than either AC or AVC. This is because it tracks incremental change and is not bogged down by the running tally of costs like AC and AVC are. The slope of the MC curve goes from downward to upward at the precise moment the total cost curve turns from flattening to steepening.

Here’s a useful tip: every time two curves intersect in economics, make note of it. More often than not, something special is happening. In this case, notice how the MC curve crosses AVC and AC at the point when they are at their minimum. In other words, the intersection with MC marks the point where they go from downward-sloping to upward-sloping. That is no coincidence. The reason is that as long as MC is below AC/AVC, then the incremental change in costs is lower than the running average, which pulls the average down. Conversely, if MC is above AC/AVC, then it is pulling the average up. By analogy, suppose your average grade from three exams is 80. If your fourth exam is lower than 80, then it will pull your average down, but if it is higher than 80, it will pull your average up. The same principle is at work in our cost curves.

Deriving the supply curve

With a good understanding of AC, AVC, and MC, let’s move on to how they’re used to get the firm’s optimal output level. We will be assuming that the market is perfectly competitive, which means that the firm is a price-taker. Later we will explore what happens when this assumption breaks down. For now, let’s say the price the firm is facing is $17. Profits are computed straightforwardly as revenues (price times quantity) minus costs; in the per unit panel, this is represented by the shaded rectangle. Move the output slider around until you find the profit-maximizing level.

Code
viewof q2 = Inputs.range([0, qMax], {label: "Output", step: 1, value: 50})
viewof fc2 = Inputs.range([0, fcMax], {label: "Fixed cost", step: 1, value: 250, disabled: true})
viewof p2 = Inputs.range([0, pMax], {label: "Price", step: .1, value: 17, disabled: true})

{
  const params = ({ q: null, fc: null, p: null, c: null });
  params.q = q2;
  params.fc = fc2;
  params.p = p2;
  const id = d3.randomInt(100000, 1000000)();
  const axisTitlesTop = ({ x: "Output", y: "$" });
  const axisTitlesBottom = ({ x: "Output", y: "$/unit" });
  
  const yScalerTop = d3.scaleLinear()
    .domain([-800, 800])
    .range([panelHeight, 0]);
  const yScalerBottom = d3.scaleLinear()
    .domain([0, acFxn({ q: qMax, fc: fcMax })])
    .range([panelHeight, 0]);
    
  const corners = ({ x1: 0, y1: yScalerBottom(params.p), x2: xScaler(params.q), y2: yScalerBottom(acFxn(params)) });

  const container = d3.create("div")
        .attr("style", "display: flex; justify-content: center");
    
  const svg = container.append("svg")
    .attr("width", width + margin.left + margin.right)
    .attr("height", height + margin.top + margin.bottom)
    .attr("viewBox", [0, 0, width + margin.left + margin.right, height + margin.top + margin.bottom])
    .attr("style", "max-width: 100%; height: auto; height: intrinsic;")
    .call(background)
    .call(labelsToggle, id);
  
  // Top panel ////////////////////////////////////////////////////////////////////////////////////
  
  const panelTop = svg.append("g")
    .attr("transform", `translate(${margin.left}, ${margin.top})`)
  
  panelTop.append("g")
    .call(clipWide, id)
    .call(addCurve, id, profit, params, yScalerTop)
    .call(yGuide, profit, params, yScalerTop);
  
  panelTop.append("g")
    .call(panelAxesT, axisTitlesTop, yScalerTop)
    .call(xGuides, profit, params, yScalerTop);
  
  panelTop.append("g")
    .attr("id", `labels-${id}`)
    .call(clipWide, id)
    .call(addLabel, "Profit", xScaler(70) + 10, yScalerTop(profitFxn({ q: 70, p: params.p, fc: params.fc })) - 10);
  
  // Bottom panel /////////////////////////////////////////////////////////////////////////////////
  
  const panelBottom = svg.append("g")
    .attr("transform", `translate(${margin.left}, ${margin.top + panelHeight + margin.between})`);
  
  panelBottom.append("g")
    .call(clipWide, id)
    .call(addArea, id, profit, corners)
    .select("path")
    .style("fill", corners.y1 < corners.y2 ? "#7fc6a4" : "#f697bb");
    
  panelBottom.append("g")
    .call(clip, id)
    .call(addCurve, id, avc, params, yScalerBottom)
    .call(addCurve, id, mc, params, yScalerBottom)
    .call(addCurve, id, ac, params, yScalerBottom)
  
  panelBottom.append("g")
    .call(clipWide, id)
    .call(yGuide, price, params, yScalerBottom)
    .call(addCurveFull, id, price, params, yScalerBottom)
    .call(yGuide, ac, params, yScalerBottom);
    
  panelBottom.append("g")
    .call(panelAxes, axisTitlesBottom)

  panelBottom.append("g")
    .attr("id", `labels-${id}`)
    .call(addLabel, "Price", width + 10, yScalerBottom(params.p))
    .call(addLabel, "AC", xScaler(95) - 10, yScalerBottom(acFxn({ q: 95, fc: params.fc })) - 10, "end")
    .call(addLabel, "AVC", xScaler(95) + 10, yScalerBottom(avcFxn({ q: 95 })) + 10)
    .call(addLabel, "MC", xScaler(63) + 10, yScalerBottom(mcFxn({ q: 63 })) + 10);
  
  // Toggle event listener ////////////////////////////////////////////////////////////////////////
  
  const cb = svg.select("foreignObject").select(`input#checkbox-${id}`)
  
  cb.on("click", () => {
    const isChecked = cb.property("checked");
    const chartLabels = svg.selectAll(`g#labels-${id}`);
    isChecked ? chartLabels.style("visibility", "visible") : chartLabels.style("visibility", "hidden");
  });
  
  return container.node();
}

We see that an output of about 59 units maximizes profits.1 Notice anything interesting? This level of \(q\) just so happens to be the point where the price line intersects the MC curve! This is a key insight in economics. It says that at the optimum, the last additional unit of output you produce should yield you as much revenue as the costs it incurs. This is best understood by considering the alternatives. If we’ve chosen an output level such that MC is below price, then producing one more unit should give us more revenue than costs, and thus increase our profits. Conversely, if MC is above price, then cutting back production by one unit reduces costs more than it reduces revenues, which again increases profits. The state of optimality is reached when price is equal to MC, or, stated more generally, when marginal revenue is equal to marginal costs.

Well, a small caveat: notice that the price line actually intersects MC on two points, first in its downward-sloping region and second in its upward-sloping region. Setting output where price crosses MC at its downward-sloping region actually minimizes profits. Naturally, if MC is below price and is falling, then we’d want to keep expanding output. Let’s clarify then that the optimal output level is where price meets the MC curve in its upward-sloping region.

Does our rule still work when the price is so low that profits are negative no matter what output level we choose? Let’s investigate. The chart below sets the price at $10.

Code
viewof q3 = Inputs.range([0, qMax], {label: "Output", step: 1, value: 50})
viewof fc3 = Inputs.range([0, fcMax], {label: "Fixed cost", step: 1, value: 250, disabled: true })
viewof p3 = Inputs.range([0, pMax], {label: "Price", step: .1, value: 10, disabled: true })

{
  const params = ({ q: null, fc: null, p: null, c: null });
  params.q = q3;
  params.p = p3;
  params.fc = fc3;
  const id = d3.randomInt(100000, 1000000)();
  const axisTitlesTop = ({ x: "Output", y: "$" });
  const axisTitlesBottom = ({ x: "Output", y: "$/unit" });
  
  const yScalerTop = d3.scaleLinear()
    .domain([-800, 800])
    .range([panelHeight, 0]);
  const yScalerBottom = d3.scaleLinear()
    .domain([0, acFxn({ q: qMax, fc: fcMax })])
    .range([panelHeight, 0]);
    
  const corners = ({ x1: 0, y1: yScalerBottom(params.p), x2: xScaler(params.q), y2: yScalerBottom(acFxn(params)) });

  const container = d3.create("div")
        .attr("style", "display: flex; justify-content: center");
    
  const svg = container.append("svg")
    .attr("width", width + margin.left + margin.right)
    .attr("height", height + margin.top + margin.bottom)
    .attr("viewBox", [0, 0, width + margin.left + margin.right, height + margin.top + margin.bottom])
    .attr("style", "max-width: 100%; height: auto; height: intrinsic;")
    .call(background)
    .call(labelsToggle, id);
  
  // Top panel ////////////////////////////////////////////////////////////////////////////////////
  
  const panelTop = svg.append("g")
    .attr("transform", `translate(${margin.left}, ${margin.top})`)
  
  panelTop.append("g")
    .call(clipWide, id)
    .call(addCurve, id, profit, params, yScalerTop)
    .call(yGuide, profit, params, yScalerTop);
  
  panelTop.append("g")
    .call(panelAxesT, axisTitlesTop, yScalerTop)
    .call(xGuides, profit, params, yScalerTop);
  
  panelTop.append("g")
    .attr("id", `labels-${id}`)
    .call(clipWide, id)
    .call(addLabel, "Profit", xScaler(70) + 10, yScalerTop(profitFxn({ q: 70, p: params.p, fc: params.fc })) - 10);
  
  // Bottom panel /////////////////////////////////////////////////////////////////////////////////
  
  const panelBottom = svg.append("g")
    .attr("transform", `translate(${margin.left}, ${margin.top + panelHeight + margin.between})`);
  
  panelBottom.append("g")
    .call(clipWide, id)
    .call(addArea, id, profit, corners)
    .select("path")
    .style("fill", corners.y1 < corners.y2 ? "#7fc6a4" : "#f697bb");
    
  panelBottom.append("g")
    .call(clip, id)
    .call(addCurveFull, id, avc, params, yScalerBottom, gray)
    .call(addCurveFull, id, ac, params, yScalerBottom, gray)
    .call(addCurve, id, mc, params, yScalerBottom)
  
  panelBottom.append("g")
    .call(clipWide, id)
    .call(yGuide, mr, params, yScalerBottom)
    .call(addCurveFull, id, mr, params, yScalerBottom)
    .call(yGuide, ac, params, yScalerBottom);
    
  panelBottom.append("g")
    .call(panelAxes, axisTitlesBottom)

  panelBottom.append("g")
    .attr("id", `labels-${id}`)
    .call(addLabel, "Price", width + 10, yScalerBottom(params.p))
    .call(addLabel, "AC", xScaler(95) - 10, yScalerBottom(acFxn({ q: 95, fc: params.fc })) - 10, "end")
    .call(addLabel, "AVC", xScaler(95) + 10, yScalerBottom(avcFxn({ q: 95 })) + 10)
    .call(addLabel, "MC", xScaler(63) + 10, yScalerBottom(mcFxn({ q: 63 })) + 10);
  
  // Toggle event listener ////////////////////////////////////////////////////////////////////////
  
  const cb = svg.select("foreignObject").select(`input#checkbox-${id}`)
  
  cb.on("click", () => {
    const isChecked = cb.property("checked");
    const chartLabels = svg.selectAll(`g#labels-${id}`);
    isChecked ? chartLabels.style("visibility", "visible") : chartLabels.style("visibility", "hidden");
  });
  
  return container.node();
}

This time, the \(MR=MC\) condition gives us an output level of about 51 and profits of –$99. If my profits are going to be negative, why don’t I just produce zero and call it a day? Well, if you tried to set \(q=0\), you’ll see that it yields profits of –$250, which is more negative than at the optimal level. The number 250, of course, is our fixed costs, and the insight here is that since we have to pay for fixed costs anyway, it’s better to produce something rather than nothing, even if we never do earn positive profits.

The price can be so low, however, that it does make more sense to quit production altogether. As an exercise, use the chart below to try and find prices for which the optimal output level is zero. Formulate a rule for what these prices must be.

Code
viewof q4 = Inputs.range([0, qMax], {label: "Output", step: 1, value: 50 })
viewof fc4 = Inputs.range([0, fcMax], {label: "Fixed cost", step: 1, value: 250, disabled: true })
viewof p4 = Inputs.range([0, pMax], {label: "Price", step: .1, value: 15 })

{
  const params = ({ q: null, fc: null, p: null, c: null });
  params.q = q4;
  params.p = p4;
  params.fc = fc4;
  const id = d3.randomInt(100000, 1000000)();
  const axisTitlesTop = ({ x: "Output", y: "$" });
  const axisTitlesBottom = ({ x: "Output", y: "$/unit" });
  
  const yScalerTop = d3.scaleLinear()
    .domain([-800, 800])
    .range([panelHeight, 0]);
  const yScalerBottom = d3.scaleLinear()
    .domain([0, acFxn({ q: qMax, fc: fcMax })])
    .range([panelHeight, 0]);
    
  const corners = ({ x1: 0, y1: yScalerBottom(params.p), x2: xScaler(params.q), y2: yScalerBottom(acFxn(params)) });
  
  const container = d3.create("div")
        .attr("style", "display: flex; justify-content: center");
    
  const svg = container.append("svg")
    .attr("width", width + margin.left + margin.right)
    .attr("height", height + margin.top + margin.bottom)
    .attr("viewBox", [0, 0, width + margin.left + margin.right, height + margin.top + margin.bottom])
    .attr("style", "max-width: 100%; height: auto; height: intrinsic;")
    .call(background)
    .call(labelsToggle, id);
  
  // Top panel ////////////////////////////////////////////////////////////////////////////////////
  
  const panelTop = svg.append("g")
    .attr("transform", `translate(${margin.left}, ${margin.top})`)
  
  panelTop.append("g")
    .call(clipWide, id)
    .call(addCurve, id, profit, params, yScalerTop)
    .call(yGuide, profit, params, yScalerTop);
  
  panelTop.append("g")
    .call(panelAxesT, axisTitlesTop, yScalerTop)
    .call(xGuides, profit, params, yScalerTop);
  
  panelTop.append("g")
    .attr("id", `labels-${id}`)
    .call(clipWide, id)
    .call(addLabel, "Profit", xScaler(70) + 10, yScalerTop(profitFxn({ q: 70, p: params.p, fc: params.fc })) - 10);
  
  // Bottom panel /////////////////////////////////////////////////////////////////////////////////
  
  const panelBottom = svg.append("g")
    .attr("transform", `translate(${margin.left}, ${margin.top + panelHeight + margin.between})`);
  
  panelBottom.append("g")
    .call(clipWide, id)
    .call(addArea, id, profit, corners)
    .select("path")
    .style("fill", corners.y1 < corners.y2 ? "#7fc6a4" : "#f697bb");
    
  panelBottom.append("g")
    .call(clip, id)
    .call(addCurveFull, id, avc, params, yScalerBottom, gray)
    .call(addCurveFull, id, ac, params, yScalerBottom, gray)
    .call(addCurve, id, mc, params, yScalerBottom)
    
  panelBottom.append("g")
    .call(clipWide, id)
    .call(yGuide, mr, params, yScalerBottom)
    .call(addCurveFull, id, mr, params, yScalerBottom)
    .call(yGuide, ac, params, yScalerBottom);
    
  panelBottom.append("g")
    .call(panelAxes, axisTitlesBottom)

  panelBottom.append("g")
    .attr("id", `labels-${id}`)
    .call(addLabel, "Price", width + 10, yScalerBottom(params.p))
    .call(addLabel, "AC", xScaler(95) - 10, yScalerBottom(acFxn({ q: 95, fc: params.fc })) - 10, "end")
    .call(addLabel, "AVC", xScaler(95) + 10, yScalerBottom(avcFxn({ q: 95 })) + 10)
    .call(addLabel, "MC", xScaler(63) + 10, yScalerBottom(mcFxn({ q: 63 })) + 10);
  
  // Shutdown point
  panelBottom.append("g")
    .append("circle")
    .attr("cx", xScaler(36))
    .attr("cy", yScalerBottom(mcFxn({ q: 36 })))
  
  // Toggle event listener ////////////////////////////////////////////////////////////////////////
  
  const cb = svg.select("foreignObject").select(`input#checkbox-${id}`)
  
  cb.on("click", () => {
    const isChecked = cb.property("checked");
    const chartLabels = svg.selectAll(`g#labels-${id}`);
    isChecked ? chartLabels.style("visibility", "visible") : chartLabels.style("visibility", "hidden");
  });
  
  return container.node();
}

The rule is that any price below the AVC curve makes zero output optimal. In these cases, each unit of output you produce cannot even pay for itself, much less your fixed costs. It is better for you to shut your business down; the point where MC and AVC intersect is known as the shutdown point.

To recap what we have established:

  1. Given a price, the firm will choose the output level that corresponds to where the price line intersects with the upward-sloping region of the MC curve.
  2. Negative profits can still be optimal if the price is enough to pay for average variable costs.
  3. The firm will not produce anything for any price below the AVC curve.

These conditions trace out our firm’s supply curve, which gives its optimal output decision for every conceivable price level. In the chart below, move the price slider around to see how output changes. You can also vary fixed costs to see how this does not affect the firm’s decision, though it does affect realized profits.

Code
viewof p5 = Inputs.range([0, pMax], {label: "Price", step: .1, value: 15 })
viewof fc5 = Inputs.range([0, fcMax], {label: "Fixed cost", step: 1, value: 250 })

{
  const params = ({ q: null, fc: null, p: null, c: null });
  params.p = p5;
  params.fc = fc5;
  
  const qShutDown = Math.floor(.56 / (.006 * 2));
  const q = (p) => {
    if (p < avcFxn({ q: qShutDown })) return 0;
    else return Math.floor((1.12 + Math.pow(.072 * p - .1856, .5)) / .036);
  };
  
  params.q = q(p5);
  const id = d3.randomInt(100000, 1000000)();
  const axisTitlesTop = ({ x: "Output", y: "$" });
  const axisTitlesBottom = ({ x: "Output", y: "$/unit" });
  
  const yScalerTop = d3.scaleLinear()
    .domain([-800, 800])
    .range([panelHeight, 0]);
  const yScalerBottom = d3.scaleLinear()
    .domain([0, acFxn({ q: qMax, fc: fcMax })])
    .range([panelHeight, 0]);
    
  const corners = ({ x1: 0, y1: yScalerBottom(params.p), x2: xScaler(params.q), y2: yScalerBottom(acFxn(params)) });
  
  const container = d3.create("div")
        .attr("style", "display: flex; justify-content: center");
    
  const svg = container.append("svg")
    .attr("width", width + margin.left + margin.right)
    .attr("height", height + margin.top + margin.bottom)
    .attr("viewBox", [0, 0, width + margin.left + margin.right, height + margin.top + margin.bottom])
    .attr("style", "max-width: 100%; height: auto; height: intrinsic;")
    .call(background)
    .call(labelsToggle, id);
  
  // Top panel ////////////////////////////////////////////////////////////////////////////////////
  
  const panelTop = svg.append("g")
    .attr("transform", `translate(${margin.left}, ${margin.top})`)
  
  panelTop.append("g")
    .call(clipWide, id)
    .call(addCurve, id, profit, params, yScalerTop)
    .call(yGuide, profit, params, yScalerTop);
  
  panelTop.append("g")
    .call(panelAxesT, axisTitlesTop, yScalerTop)
    .call(xGuides, profit, params, yScalerTop);
  
  panelTop.append("g")
    .attr("id", `labels-${id}`)
    .call(clipWide, id)
    .call(addLabel, "Profit", xScaler(70) + 10, yScalerTop(profitFxn({ q: 70, p: params.p, fc: params.fc })) - 10);
  
  // Bottom panel /////////////////////////////////////////////////////////////////////////////////
  
  const panelBottom = svg.append("g")
    .attr("transform", `translate(${margin.left}, ${margin.top + panelHeight + margin.between})`);
  
  panelBottom.append("g")
    .call(clipWide, id)
    .call(addArea, id, profit, corners)
    .select("path")
    .style("fill", corners.y1 < corners.y2 ? "#7fc6a4" : "#f697bb");
    
  panelBottom.append("g")
    .call(clip, id)
    .call(addCurveFull, id, avc, params, yScalerBottom, gray)
    .call(addCurveFull, id, ac, params, yScalerBottom, gray)
    .call(addCurveFull, id, mc, params, yScalerBottom, gray)
  
   panelBottom.append("g")
    .call(clipWide, id)
    .call(yGuide, mr, params, yScalerBottom)
    .call(addCurveFull, id, mr, params, yScalerBottom)
    .call(addCurve, id, supply, params, yScalerBottom)
    .call(yGuide, ac, params, yScalerBottom)
    
  panelBottom.append("g")
    .call(panelAxes, axisTitlesBottom)
  
  // Vertical portion of supply curve
  
  panelBottom.append("g")
    .attr("id", `${supply.id}-${id}`)
    .attr("pointer-events", "visibleStroke")
    .call(clipWide, id)
    .append("path")
    .attr("class", "curve colored")
    .attr("d", line([[0, panelHeight], [0, yScalerBottom(avcFxn({ q: qShutDown }))], [1, yScalerBottom(avcFxn({ q: qShutDown }))]]))
    .style("fill", "none")
    .style("stroke", blue.base)
    .style("stroke-width", strokeWidth)
    .on("mousemove", (event) => {
      d3.selectAll(`#${supply.id}-${id} .curve`)
        .transition().duration(50)
        .style("stroke-width", strokeWidth + 2)
        .style("stroke", supply.scheme.baseSelect);
      tooltip
        .style("left", event.pageX + 18 + "px")
        .style("top", event.pageY + 18 + "px")
        .style("display", "block")
        .text(supply.label);
      d3.select(event.target).style("cursor", "pointer");
    })
    .on("mouseleave", (event) => {
      d3.selectAll(`#${supply.id}-${id} .curve`)
        .transition().duration(100)
        .style("stroke-width", strokeWidth)
        .style("stroke", supply.scheme.base);
      tooltip.style("display", "none");
      d3.select(event.target).style("cursor", "default");
    });

  panelBottom.append("g")
    .attr("id", `labels-${id}`)
    .call(addLabel, "Price", width + 10, yScalerBottom(params.p))
    .call(addLabel, "AC", xScaler(95) - 10, yScalerBottom(acFxn({ q: 95, fc: params.fc })) - 10, "end")
    .call(addLabel, "AVC", xScaler(95) + 10, yScalerBottom(avcFxn({ q: 95 })) + 10)
    .call(addLabel, "Supply", xScaler(69) + 5, yScalerBottom(mcFxn({ q: 69 })) - 25, "middle");
  
  // Toggle event listener ////////////////////////////////////////////////////////////////////////
  
  const cb = svg.select("foreignObject").select(`input#checkbox-${id}`)
  
  cb.on("click", () => {
    const isChecked = cb.property("checked");
    const chartLabels = svg.selectAll(`g#labels-${id}`);
    isChecked ? chartLabels.style("visibility", "visible") : chartLabels.style("visibility", "hidden");
  });
  
  return container.node();
}

In the long run, fixed costs reach zero and the AC and AVC curves converge. This would imply that profits cannot be negative in the long run — firms are either participating in the market with positive profits or else have shut down their business (use the chart above to verify). This actually extends to a broader and more surprising prediction: in the long run, profits can neither be positive nor negative. They must always be zero!

In the room the firms come and go

This prediction stems from the assumption that without the hindrance of fixed costs, firms can freely enter and exit the market. Any market where participating firms are enjoying positive profits will attract the entry of more firms, which increases supply and drives down the price. Firms will keep entering until it makes no more economic sense to do so, which is the point when prevailing profits have reached zero. Likewise, firms will exit markets where profits are negative, reducing supply and raising prices until profits are brought to zero. The chart below depicts the long-run equilibrium for a firm in our perfectly competitive market.

Code
{
  const params = ({ q: null, fc: null, p: null, c: null });
  const qShutDown = Math.floor(.56 / (.006 * 2));
  params.p = 6.9;
  params.fc = 0;
  params.q = 46;
  const id = d3.randomInt(100000, 1000000)();
  const axisTitlesTop = ({ x: "Output", y: "$" });
  const axisTitlesBottom = ({ x: "Output", y: "$/unit" });
  
  const yScalerTop = d3.scaleLinear()
    .domain([-800, 800])
    .range([panelHeight, 0]);
  const yScalerBottom = d3.scaleLinear()
    .domain([0, acFxn({ q: qMax, fc: fcMax })])
    .range([panelHeight, 0]);
    
  const corners = ({ x1: 0, y1: yScalerBottom(params.p), x2: xScaler(params.q), y2: yScalerBottom(acFxn(params)) });
  
  const container = d3.create("div")
        .attr("style", "display: flex; justify-content: center");
    
  const svg = container.append("svg")
    .attr("width", width + margin.left + margin.right)
    .attr("height", height + margin.top + margin.bottom)
    .attr("viewBox", [0, 0, width + margin.left + margin.right, height + margin.top + margin.bottom])
    .attr("style", "max-width: 100%; height: auto; height: intrinsic;")
    .call(background)
    .call(labelsToggle, id);
  
  // Top panel ////////////////////////////////////////////////////////////////////////////////////
  
  const panelTop = svg.append("g")
    .attr("transform", `translate(${margin.left}, ${margin.top})`)
  
  panelTop.append("g")
    .call(clipWide, id)
    .call(addCurve, id, profit, params, yScalerTop)

  panelTop.append("g")
    .call(panelAxesT, axisTitlesTop, yScalerTop)
    .call(xGuides, profit, params, yScalerTop);
  
  panelTop.append("g")
    .attr("id", `labels-${id}`)
    .call(clipWide, id)
    .call(addLabel, "Profit", xScaler(70) + 10, yScalerTop(profitFxn({ q: 70, p: params.p, fc: params.fc })) - 10);

  panelTop.append("g")
    .append("text")
    .text(0)
    .attr("x", 0)
    .attr("y", data(profit.fxn, params, yScalerTop)[params.q][1])
    .attr("dx", -10)
    .attr("text-anchor", "end")
    .attr("alignment-baseline", "middle")
    .style("fill", "black")
    .style("font-size", ".9rem");
  
  // Bottom panel /////////////////////////////////////////////////////////////////////////////////
  
  const panelBottom = svg.append("g")
    .attr("transform", `translate(${margin.left}, ${margin.top + panelHeight + margin.between})`);
  
  panelBottom.append("g")
    .call(clipWide, id)
    .call(addArea, id, profit, corners)
    .select("path")
    .style("fill", corners.y1 < corners.y2 ? "#7fc6a4" : "#f697bb");
    
  panelBottom.append("g")
    .call(clip, id)
    .call(addCurveFull, id, ac, params, yScalerBottom, gray)
    .call(addCurveFull, id, mc, params, yScalerBottom, gray)
  
  panelBottom.append("g")
    .call(clipWide, id)
    .call(yGuide, mr, params, yScalerBottom)
    .call(addCurveFull, id, mr, params, yScalerBottom)
    .call(addCurve, id, supply, params, yScalerBottom)

  panelBottom.append("g")
    .call(panelAxes, axisTitlesBottom)
  
  // Vertical portion of supply curve
  
  panelBottom.append("g")
    .attr("id", `${supply.id}-${id}`)
    .attr("pointer-events", "visibleStroke")
    .call(clipWide, id)
    .append("path")
    .attr("class", "curve colored")
    .attr("d", line([[0, panelHeight], [0, yScalerBottom(avcFxn({ q: qShutDown }))], [1, yScalerBottom(avcFxn({ q: qShutDown }))]]))
    .style("fill", "none")
    .style("stroke", blue.base)
    .style("stroke-width", strokeWidth)
    .on("mousemove", (event) => {
      d3.selectAll(`#${supply.id}-${id} .curve`)
        .transition().duration(50)
        .style("stroke-width", strokeWidth + 2)
        .style("stroke", supply.scheme.baseSelect);
      tooltip
        .style("left", event.pageX + 18 + "px")
        .style("top", event.pageY + 18 + "px")
        .style("display", "block")
        .text(supply.label);
      d3.select(event.target).style("cursor", "pointer");
    })
    .on("mouseleave", (event) => {
      d3.selectAll(`#${supply.id}-${id} .curve`)
        .transition().duration(100)
        .style("stroke-width", strokeWidth)
        .style("stroke", supply.scheme.base);
      tooltip.style("display", "none");
      d3.select(event.target).style("cursor", "default");
    });

  panelBottom.append("g")
    .attr("id", `labels-${id}`)
    .call(addLabel, "Price", width + 10, yScalerBottom(params.p))
    .call(addLabel, "AC", xScaler(95) - 10, yScalerBottom(acFxn({ q: 95, fc: params.fc })) - 10, "end")
    .call(addLabel, "Supply", xScaler(69) + 5, yScalerBottom(mcFxn({ q: 69 })) - 25, "middle");
  
  // Toggle event listener ////////////////////////////////////////////////////////////////////////
  
  const cb = svg.select("foreignObject").select(`input#checkbox-${id}`)
  
  cb.on("click", () => {
    const isChecked = cb.property("checked");
    const chartLabels = svg.selectAll(`g#labels-${id}`);
    isChecked ? chartLabels.style("visibility", "visible") : chartLabels.style("visibility", "hidden");
  });
  
  return container.node();
}

It’s important to clarify a couple of things with regard to interpretation. “Costs” here are understood broadly, meaning they include the wages that businessowners pay to themselves. It’s better to think of “zero” profits in a normalized sense, as in firms are not making any outsized profits relative to what firms on average can make.

Second, this result only applies to perfectly competitive markets, which are idealized scenarios that do not describe anything found in reality. The key assumption here is that firms are numerous enough and small enough that their actions have no influence on prevailing prices. But this seldom holds. Let’s now turn to the opposite extreme, the case where the market is dominated by just a single seller.

The only game in town

Facing no competitors, a monopoly exercises full control over its price. Of course, this doesn’t mean it can force people to buy its product, so there’s still an optimality decision to be made. Given its cost structure and the demand it faces, how much and at what price should it produce so as to maximize profits?

Let’s first look at how price-setting power can be included in our model. In the chart below, the first panel shows what we have been working with. This actually reflects a special case where the demand curve, the MR curve, and the price line all coincide, such that no matter what output level the firm operates at, demand, marginal revenue, and price will all remain the same.

Code
viewof q6 = Inputs.range([0, qMax], {label: "Output", step: 1, value: 50 });
Code
{
  const params = ({ q: null, fc: null, p: null, c: null });
  params.q = q6;
  params.p = 15;
  const id = d3.randomInt(100000, 1000000)();
  const axisTitles = ({ x: "Output", y: "$" });

  const yScaler = d3.scaleLinear()
    .domain([0, acFxn({ q: qMax, fc: fcMax })])
    .range([panelHeight, 0]);
  
  const container = d3.create("div")
        .attr("style", "display: flex; justify-content: center");
        
  const svg = container.append("svg")
    .attr("width", width + margin.left + margin.right)
    .attr("height", panelHeight + margin.top + margin.bottom)
    .attr("viewBox", [0, 0, width + margin.left + margin.right, panelHeight + margin.top + margin.bottom])
    .attr("style", "max-width: 100%; height: auto; height: intrinsic;")
    .call(background)
    .call(labelsToggle, id);
  
  const panel = svg.append("g")
    .attr("transform", `translate(${margin.left}, ${margin.top})`);
  
  panel.append("g")
    .call(panelAxes, axisTitles)
    .call(yGuide, mr, params, yScaler)
    .call(xGuides, mr, params, yScaler, 1)
    .call(addCurve, id, mr, params, yScaler);
  
  panel.append("g")
    .attr("id", `labels-${id}`)
    .call(addLabel, "Price = Demand = MR", xScaler(55), yScaler(params.p) - 20);
   
  // Toggle event listener ////////////////////////////////////////////////////////////////////////
  
  const cb = svg.select("foreignObject").select(`input#checkbox-${id}`);
  
  cb.on("click", () => {
    const isChecked = cb.property("checked");
    const chartLabels = svg.selectAll(`g#labels-${id}`);
    isChecked ? chartLabels.style("visibility", "visible") : chartLabels.style("visibility", "hidden");
  });
  
  return container.node();
}
Code
{
  const params = ({ q: null, fc: null, p: null, c: null });
  params.q = q6;
  const p6 = demandMonoFxn({ q: q6 });
  params.p = p6;
  const id = d3.randomInt(100000, 1000000)();
  const axisTitles = ({ x: "Output", y: "$" });
  
  const yScaler = d3.scaleLinear()
    .domain([0, acFxn({ q: qMax, fc: fcMax })])
    .range([panelHeight, 0]);
  
  const container = d3.create("div")
        .attr("style", "display: flex; justify-content: center");
        
  const svg = container.append("svg")
    .attr("width", width + margin.left + margin.right)
    .attr("height", panelHeight + margin.top + margin.bottom)
    .attr("viewBox", [0, 0, width + margin.left + margin.right, panelHeight + margin.top + margin.bottom])
    .attr("style", "max-width: 100%; height: auto; height: intrinsic;")
    .call(background)
    .call(labelsToggle, id);
  
  const panel = svg.append("g")
    .attr("transform", `translate(${margin.left}, ${margin.top})`)
    
  panel.append("g")
    .call(clipWide, id)
    .call(yGuide, mrMono, params, yScaler)
    .call(yGuide, demandMono, params, yScaler);
  
  panel.append("g")
    .call(clip, id)
    .call(addCurveFull, id, mr, params, yScaler, gray)
    .call(addCurve, id, mrMono, params, yScaler)
    .call(addCurve, id, demandMono, params, yScaler)
  
  panel.append("g")
    .call(panelAxes, axisTitles)
    .call(xGuides, demandMono, params, yScaler, 1);
  
  panel.append("g")
    .attr("id", `labels-${id}`)
    .call(clipWide, id)
    .call(addLabel, "Price", width + 10, yScaler(params.p))
    .call(addLabel, "Demand", xScaler(66) + 10, yScaler(demandMonoFxn({ q: 66 })) - 10)
    .call(addLabel, "MR", xScaler(33) + 10, yScaler(mrMonoFxn({ q: 33 })) - 10);
   
  // Toggle event listener ////////////////////////////////////////////////////////////////////////
  
  const cb = svg.select("foreignObject").select(`input#checkbox-${id}`)
  
  cb.on("click", () => {
    const isChecked = cb.property("checked");
    const chartLabels = svg.selectAll(`g#labels-${id}`);
    isChecked ? chartLabels.style("visibility", "visible") : chartLabels.style("visibility", "hidden");
  });
  
  return container.node();
}

The second panel depicts what would happen if the firm was influential enough to affect demand. Faced with downward-sloping demand, its output decision now has an impact on price: more output depresses it, less output increases it. The MR curve is now also downward-sloping, with a rate of change that is twice as fast as demand.2

Let’s now combine our new demand and MR curves with our cost curves. Take a deep breath — the chart below may look quite complicated at first. But if you’ve made it this far, you already have all the tools you need to understand it.

Code
viewof p7 = Inputs.range([0, pMax], {label: "Price", step: .1, value: 15 })
viewof fc7 = Inputs.range([0, fcMax], {label: "Fixed cost", step: 1, value: 180 })

{
  const params = ({ q: null, fc: null, p: null, c: null });
  const q = (p) => Math.floor((27 - p) / (27/95));
  params.q = q(p7);
  params.p = p7;
  params.fc = fc7;
  
  const id = d3.randomInt(100000, 1000000)();
  const axisTitlesTop = ({ x: "Output", y: "$" });
  const axisTitlesBottom = ({ x: "Output", y: "$/unit" });
  
  const yScalerTop = d3.scaleLinear()
    .domain([-1000, 400])
    .range([panelHeight, 0]);
  const yScalerBottom = d3.scaleLinear()
    .domain([0, acFxn({ q: qMax, fc: fcMax })])
    .range([panelHeight, 0]);
    
  const corners = ({ x1: 0, y1: yScalerBottom(params.p), x2: xScaler(params.q), y2: yScalerBottom(acFxn(params)) });
  
  const container = d3.create("div")
        .attr("style", "display: flex; justify-content: center");
    
  const svg = container.append("svg")
    .attr("width", width + margin.left + margin.right)
    .attr("height", height + margin.top + margin.bottom)
    .attr("viewBox", [0, 0, width + margin.left + margin.right, height + margin.top + margin.bottom])
    .attr("style", "max-width: 100%; height: auto; height: intrinsic;")
    .call(background)
    .call(labelsToggle, id);
  
  // Top panel ////////////////////////////////////////////////////////////////////////////////////
  
  const panelTop = svg.append("g")
    .attr("transform", `translate(${margin.left}, ${margin.top})`)
  
  panelTop.append("g")
    .call(clipWide, id)
    .call(addCurve, id, profitMono, params, yScalerTop)
    .call(yGuide, profitMono, params, yScalerTop);
  
  panelTop.append("g")
    .call(panelAxesT, axisTitlesTop, yScalerTop)
    .call(xGuides, profitMono, params, yScalerTop);
  
  panelTop.append("g")
    .attr("id", `labels-${id}`)
    .call(clipWide, id)
    .call(addLabel, "Profit", xScaler(70) + 10, yScalerTop(profitMonoFxn({ q: 70, fc: params.fc })) - 10);
  
  // Bottom panel /////////////////////////////////////////////////////////////////////////////////
  
  const panelBottom = svg.append("g")
    .attr("transform", `translate(${margin.left}, ${margin.top + panelHeight + margin.between})`);
  
  panelBottom.append("g")
    .call(clipWide, id)
    .call(addArea, id, profitMono, corners)
    .select("path")
    .style("fill", corners.y1 < corners.y2 ? "#7fc6a4" : "#f697bb");
    
  panelBottom.append("g")
    .call(clip, id)
    .call(addCurveFull, id, mr, params, yScalerBottom, gray)
    .call(addCurve, id, ac, params, yScalerBottom)
    .call(addCurve, id, mc, params, yScalerBottom)
    .call(addCurve, id, demandMono, params, yScalerBottom)
    .call(addCurve, id, mrMono, params, yScalerBottom)
  
  panelBottom.append("g")
    .call(clipWide, id)
    .call(yGuide, ac, params, yScalerBottom)
    .call(yGuide, mc, params, yScalerBottom)
    .call(yGuide, mrMono, params, yScalerBottom)
    .call(yGuide, demandMono, params, yScalerBottom);
    
  panelBottom.append("g")
    .call(panelAxes, axisTitlesBottom)
  
  panelBottom.append("g")
    .attr("id", `labels-${id}`)
    .call(addLabel, "Price", width + 10, yScalerBottom(params.p))
    .call(addLabel, "AC", xScaler(95) - 10, yScalerBottom(acFxn({ q: 95, fc: params.fc })) - 10, "end")
    .call(addLabel, "MC", xScaler(63) + 10, yScalerBottom(mcFxn({ q: 63 })) + 10)
    .call(addLabel, "Demand", xScaler(84) + 10, yScalerBottom(demandMonoFxn({ q: 84 })) - 10)
    .call(addLabel, "MR", xScaler(45) + 10, yScalerBottom(mrMonoFxn({ q: 45 })) - 10);

  // Toggle event listener ////////////////////////////////////////////////////////////////////////
  
  const cb = svg.select("foreignObject").select(`input#checkbox-${id}`)
  
  cb.on("click", () => {
    const isChecked = cb.property("checked");
    const chartLabels = svg.selectAll(`g#labels-${id}`);
    isChecked ? chartLabels.style("visibility", "visible") : chartLabels.style("visibility", "hidden");
  });
  
  return container.node();
}

Start by playing around with the price level. How does it affect profits? Recall that in the perfectly competitive case, we found that maximum profits are attained at the output level that equates marginal revenue with marginal cost. Can we find the same condition here? It turns out yes! Maximum profits in the monopoly case are still attained when \(MR = MC\), except this time, prices are set at the point where output meets the demand curve.

Here is the big difference with a monopoly: the equilibrium price is set above marginal cost. Moreover, since there is no free entry and exit, there is no mechanism by which the profits of a monopoly can be brought down to zero. Barring any non-market intervention like regulation, these profits are just something monopolies can keep forever.

What’s wrong with all this? It’s beyond the scope of this humble blog post, but to give the broad strokes, economic theory suggests that it is socially optimal for the prices of goods and services to be set as close as possible to the marginal cost of producing those goods and services. Whenever prices are above marginal costs, there is an efficiency loss in the economy. The chart below illustrates this for the case of a monopoly. Toggle between the monopoly outcome and the social optimum to see that monopolies result in lower output at higher prices.

Code
{
  const params = ({ q: null, fc: null, p: null, c: null });
  const q = (p) => Math.floor((27 - p) / (27/95));
  const pMonopoly = 15.5;
  const pCompetitive = 11.5;
  params.fc = 180;
  
  const id = d3.randomInt(100000, 1000000)();
  const axisTitlesTop = ({ x: "Output", y: "$" });
  const axisTitlesBottom = ({ x: "Output", y: "$/unit" });
  
  const yScalerTop = d3.scaleLinear()
    .domain([-1000, 400])
    .range([panelHeight, 0]);
  const yScalerBottom = d3.scaleLinear()
    .domain([0, acFxn({ q: qMax, fc: fcMax })])
    .range([panelHeight, 0]);
    
  const container = d3.create("div")
        .attr("style", "display: flex; justify-content: center");
    
  const svg = container.append("svg")
    .attr("width", width + margin.left + margin.right)
    .attr("height", height + margin.top + margin.bottom)
    .attr("viewBox", [0, 0, width + margin.left + margin.right, height + margin.top + margin.bottom])
    .attr("style", "max-width: 100%; height: auto; height: intrinsic;")
    .call(background)
    .call(labelsToggle, id);
  
  // Top panel ////////////////////////////////////////////////////////////////////////////////////
  
  const panelTop = svg.append("g")
    .attr("transform", `translate(${margin.left}, ${margin.top})`)
  
  panelTop.append("g")
    .call(clipWide, id)
    .call(addCurveFull, id, profitMono, params, yScalerTop);
  
  panelTop.append("g")
    .call(panelAxesT, axisTitlesTop, yScalerTop)
  
  panelTop.append("g")
    .attr("id", `labels-${id}`)
    .call(clipWide, id)
    .call(addLabel, "Profit", xScaler(70) + 10, yScalerTop(profitMonoFxn({ q: 70, fc: params.fc })) - 10);
  
  panelTop.append("g")
    .attr("id", `guides-monopoly-${id}`)
    .call(yGuide, profitMono, ({ q: q(pMonopoly), fc: 180, p: pMonopoly }), yScalerTop)
    .call(xGuides, profitMono, ({ q: q(pMonopoly), fc: 180, p: pMonopoly }), yScalerTop);
  
  panelTop.append("g")
    .attr("id", `guides-competitive-${id}`)
    .call(yGuide, profitMono, ({ q: q(pCompetitive), fc: 180, p: pCompetitive }), yScalerTop)
    .call(xGuides, profitMono, ({ q: q(pCompetitive), fc: 180, p: pCompetitive }), yScalerTop);
    
  // Bottom panel /////////////////////////////////////////////////////////////////////////////////
  
  const panelBottom = svg.append("g")
    .attr("transform", `translate(${margin.left}, ${margin.top + panelHeight + margin.between})`);
  
  panelBottom.append("g")
    .call(clip, id)
    .call(addCurveFull, id, mc, params, yScalerBottom)
    .call(addCurveFull, id, demandMono, params, yScalerBottom)
    .call(addCurveFull, id, mrMono, params, yScalerBottom);
    
  panelBottom.append("g")
    .call(panelAxes, axisTitlesBottom);
  
  panelBottom.append("g")
    .attr("id", `labels-${id}`)
    .call(addLabel, "MC", xScaler(63) + 10, yScalerBottom(mcFxn({ q: 63 })) + 10)
    .call(addLabel, "Demand", xScaler(84) + 10, yScalerBottom(demandMonoFxn({ q: 84 })) - 10)
    .call(addLabel, "MR", xScaler(45) + 10, yScalerBottom(mrMonoFxn({ q: 45 })) - 10);

  panelBottom.append("g")
    .attr("id", `guides-monopoly-${id}`)
    .call(yGuide, demandMono, ({ q: q(pMonopoly), fc: 180, p: pMonopoly }), yScalerBottom);

  panelBottom.append("g")
    .attr("id", `guides-competitive-${id}`)
    .call(yGuide, demandMono, ({ q: q(pCompetitive), fc: 180, p: pCompetitive }), yScalerBottom);
  
  // Toggle event listener ////////////////////////////////////////////////////////////////////////
  
  const cb = svg.selectAll("foreignObject").select(`input#checkbox-${id}`)
  
  cb.on("click", () => {
    const isChecked = cb.property("checked");
    const chartLabels = svg.selectAll(`g#labels-${id}`);
    isChecked ? chartLabels.style("visibility", "visible") : chartLabels.style("visibility", "hidden");
  });
  
  // Chart event listeners ////////////////////////////////////////////////////////////////////////
  
  const checkboxMonopoly = svg.append("foreignObject")
    .attr("x", 400)
    .attr("y",  475)
    .attr("width", 20)
    .attr("height", 20);
  
  checkboxMonopoly.append("xhtml:input")
    .attr("type", "checkbox")
    .attr("id", `checkbox-monopoly-${id}`)
    .property("checked", true);
  
  svg.append("g")
    .append("text")
    .text("Monopoly outcome")
    .attr("x", 400 + 20)
    .attr("y", 475 + 5)
    .attr("text-anchor", "start")
    .attr("alignment-baseline", "hanging")
    .style("fill", "black");
    
  const checkboxCompetitive = svg.append("foreignObject")
    .attr("x", 400)
    .attr("y",  475 + 25)
    .attr("width", 20)
    .attr("height", 20);
  
  checkboxCompetitive.append("xhtml:input")
    .attr("type", "checkbox")
    .attr("id", `checkbox-competitive-${id}`)
    .property("checked", false);
  
  svg.append("g")
    .append("text")
    .text("Social optimum")
    .attr("x", 400 + 20)
    .attr("y", 475 + 5 + 25)
    .attr("text-anchor", "start")
    .attr("alignment-baseline", "hanging")
    .style("fill", "black");
  
  const cbMonopoly = svg.selectAll("foreignObject").select(`input#checkbox-monopoly-${id}`);
  const cbCompetitive = svg.selectAll("foreignObject").select(`input#checkbox-competitive-${id}`);
  svg.selectAll(`g#guides-competitive-${id}`).style("visibility", "hidden");
  
  cbMonopoly.on("click", () => {
    const isChecked = cbMonopoly.property("checked");
    const guidesMonopoly = svg.selectAll(`g#guides-monopoly-${id}`);
    isChecked ? guidesMonopoly.style("visibility", "visible") : guidesMonopoly.style("visibility", "hidden");
  });
  
  cbCompetitive.on("click", () => {
    const isChecked = cbCompetitive.property("checked");
    const guidesCompetitive = svg.selectAll(`g#guides-competitive-${id}`);
    isChecked ? guidesCompetitive.style("visibility", "visible") : guidesCompetitive.style("visibility", "hidden");
  });
  
  return container.node();
}

Just as with with perfect competition, complete monopolies are extremely rare in the real world. Barring natural monopolies like transport terminals and utilities, it’s near impossible for a firm to control the production of a good so exclusively that no one else can sell anything even remotely similar. It’s more often the case that a firm has a monopoly on a brand, but not on a product. While it’s true that Apple has a monopoly on selling the iPhone, it doesn’t have a monopoly on smartphones in general. Or to take a more topical example, the proposed acquisition by Microsoft of Activision Blizzard has raised alarm bells over the monopolization of the video game industry, but while the new entity would control several popular franchises, the video game market in general would still have plenty of sellers.

This cross between perfect competition and monopolies is its own class of market structure called monopolistic competition. Its defining trait is that while each firm holds a monopoly over its product, the product itself is substitutable to varying degrees with similar products made by other firms. Firms are free to enter and exit the market for the product class. This has wide application to many of the industries we as consumers care about: smartphones, search engines, streaming services, clothes, appliances, and so on.

Monopolistic competition is easy to incorporate in our model of the monopoly. All the curves will remain the same; the only difference is that in the long run, the entry of new firms in a profitable monopolistic market will diminish the demand our monopolist faces. As with perfect competition, this entry will go on until the monopoly’s profits dwindle to zero. Try it yourself by sliding the market size down in the chart below.

Code
viewof demandCoef = Inputs.range([16.8, 25], {label: "Market size", step: .1, value: 27 })
viewof fc8 = Inputs.range([0, fcMax], {label: "Fixed cost", step: 1, value: 0, disabled: true })

{
  const params = ({ q: null, fc: null, p: null, c: null });
  params.fc = fc8;
  params.c = demandCoef;
  
  const b = 54/95 - 1.12;
  const qFxn = ({ c }) => Math.floor( (1/.036) * (-b + Math.pow( Math.pow(b, 2) - 1.44 + .072 * c, .5 ) ) );
  const demandMonoCompFxn = ({ q, c } = {}) => c - (27/95) * q;
  const mrMonoCompFxn = ({ q, c } = {}) => c - 2 * (27/95) * q;
  const profitMonoCompFxn = ({ q, fc, c } = {}) => {
    return Math.ceil(demandMonoCompFxn({ q, c }) * q - costFxn({ q, fc }));
  }
  const p = ({ q, c }) => demandMonoCompFxn({ q: qFxn({ c: params.c }), c: params.c });
  
  params.q = qFxn({ c: params.c });
  params.p = p({ q: qFxn({ c: params.c }), c: params.c });
  
  demandMonoComp.fxn = demandMonoCompFxn;
  mrMonoComp.fxn = mrMonoCompFxn;
  profitMonoComp.fxn = profitMonoCompFxn;
  
  const id = d3.randomInt(100000, 1000000)();
  const axisTitlesTop = ({ x: "Output", y: "$" });
  const axisTitlesBottom = ({ x: "Output", y: "$/unit" });
  
  const yScalerTop = d3.scaleLinear()
    .domain([-1000, 400])
    .range([panelHeight, 0]);
  const yScalerBottom = d3.scaleLinear()
    .domain([0, acFxn({ q: qMax, fc: fcMax })])
    .range([panelHeight, 0]);
    
  const demandMonoCompInvFxn = ({ dmd, c } = {}) => (95/27) * (c - dmd);
  const mrMonoCompInvFxn = ({ mr, c } = {}) => (95/(27*2)) * (c - mr);
  const corners = ({ x1: 0, y1: yScalerBottom(params.p), x2: xScaler(params.q), y2: yScalerBottom(acFxn(params)) });
  
  const container = d3.create("div")
        .attr("style", "display: flex; justify-content: center");
    
  const svg = container.append("svg")
    .attr("width", width + margin.left + margin.right)
    .attr("height", height + margin.top + margin.bottom)
    .attr("viewBox", [0, 0, width + margin.left + margin.right, height + margin.top + margin.bottom])
    .attr("style", "max-width: 100%; height: auto; height: intrinsic;")
    .call(background)
    .call(labelsToggle, id);
  
  // Top panel ////////////////////////////////////////////////////////////////////////////////////
  
  const panelTop = svg.append("g")
    .attr("transform", `translate(${margin.left}, ${margin.top})`)
  
  panelTop.append("g")
    .call(clipWide, id)
    .call(addCurve, id, profitMonoComp, params, yScalerTop)
    .call(yGuide, profitMonoComp, params, yScalerTop);
  
  panelTop.append("g")
    .call(panelAxesT, axisTitlesTop, yScalerTop)
    .call(xGuides, profitMonoComp, params, yScalerTop);
  
  panelTop.append("g")
    .attr("id", `labels-${id}`)
    .call(clipWide, id)
    .call(addLabel, "Profit", xScaler(70) + 10, yScalerTop(profitMonoCompFxn({ q: 70, fc: params.fc, c: params.c })) - 10);
  
  // Bottom panel /////////////////////////////////////////////////////////////////////////////////
  
  const panelBottom = svg.append("g")
    .attr("transform", `translate(${margin.left}, ${margin.top + panelHeight + margin.between})`);
  
  panelBottom.append("g")
    .call(clipWide, id)
    .call(addArea, id, profitMono, corners)
    .select("path")
    .style("fill", corners.y1 < corners.y2 ? "#7fc6a4" : "#f697bb");
    
  panelBottom.append("g")
    .call(clip, id)
    .call(addCurveFull, id, price, params, yScalerBottom, gray)
    .call(addCurve, id, ac, params, yScalerBottom)
    .call(addCurve, id, mc, params, yScalerBottom)
    .call(addCurve, id, demandMonoComp, params, yScalerBottom)
    .call(addCurve, id, mrMonoComp, params, yScalerBottom)
  
  panelBottom.append("g")
    .call(clipWide, id)
    .call(yGuide, ac, params, yScalerBottom)
    .call(yGuide, demandMonoComp, params, yScalerBottom);
    
  panelBottom.append("g")
    .call(panelAxes, axisTitlesBottom)
  
  panelBottom.append("g")
    .attr("id", `labels-${id}`)
    .call(addLabel, "Price", width + 10, yScalerBottom(params.p))
    .call(addLabel, "AC", xScaler(95) - 10, yScalerBottom(acFxn({ q: 95, fc: params.fc })) - 10, "end")
    .call(addLabel, "MC", xScaler(63) + 10, yScalerBottom(mcFxn({ q: 63 })) + 10)
    .call(addLabel, "Demand", xScaler(demandMonoCompInvFxn({ dmd: 1, c: params.c})) + 10, yScalerBottom(1) - 10)
    .call(addLabel, "MR", xScaler(mrMonoCompInvFxn({ mr: 1, c: params.c })) + 10, yScalerBottom(1) - 10);

  // Toggle event listener ////////////////////////////////////////////////////////////////////////
  
  const cb = svg.select("foreignObject").select(`input#checkbox-${id}`)
  
  cb.on("click", () => {
    const isChecked = cb.property("checked");
    const chartLabels = svg.selectAll(`g#labels-${id}`);
    isChecked ? chartLabels.style("visibility", "visible") : chartLabels.style("visibility", "hidden");
  });
  
  return container.node();
}

Notice however that the long-run equilibrium under monopolistic competition still enatils lower output at higher prices compared with perfect competition. While Apple and its friends do face competitive pressures from each other, product differentiation means that their profit-maximizing level of output is below the social optimum. Do note that this takes a very narrow conception of the social optimum, in that it only accounts for prices and output. An argument can be made that while a monopolistic competitor can reap more monopoly profits by further differentiating its product, the fact that it results in better smartphones, video games, and appliances redounds ultimately to the consumer’s benefit. But that’s a topic for another day.

Concluding thoughts

This blog post demonstrates how interactive charts can be used to enrich the teaching of economics. I have used D3 and Quarto’s built-in Observable engine here, but more broadly, the use of webpages in constructing learning modules lets us take full advantage of HTML, CSS, and Javascript functionality. We can spice the text up by adding highlighting, animation, and gratuitous Pikachu faces .

Economists are always referring to “toy models” of the economy. It’s time we get to play with them.

D3 / Observable code

Code
costFxn = ({ q, fc } = {}) => {
  return .006 * Math.pow(q, 3) - .56 * Math.pow(q, 2) + 20 * q + fc
};
acFxn = ({ q, fc } = {}) => {
  if (isNaN(costFxn({ q, fc }) / q)) return .006 * Math.pow(q, 2) - .56 * q + 20
  else if (q === 0) return null
  else return costFxn({ q, fc }) / q
};
avcFxn = ({q} = {}) => .006 * Math.pow(q, 2) - .56 * q + 20;
mcFxn = ({q} = {}) => .006 * 3 * Math.pow(q, 2) - .56 * 2 * q + 20;
profitFxn = ({ q, p, fc } = {}) => p * q - costFxn({ q, fc });
supplyFxn = ({q} = {}) => {
  const minAVCq = Math.floor(.56 / (.006 * 2));
  if (q < minAVCq + 1) return avcFxn({ q: minAVCq });
  else return mcFxn({ q });
}
mrFxn = ({p} = {}) => p;
demandMonoFxn = ({q} = {}) => 27 - (27/95) * q;
mrMonoFxn = ({q} = {}) => 27 - 2 * (27/95) * q;
profitMonoFxn = ({ q, fc } = {}) => {
  return demandMonoFxn({q}) * q - costFxn({ q, fc })
};

cost = ({ fxn: costFxn, label: "Cost", id: "cost-curve", scheme: red });
ac = ({ fxn: acFxn, label: "Average cost", id: "ac-curve", scheme: blue });
avc = ({ fxn: avcFxn, label: "Average variable cost", id: "avc-curve", scheme: blue });
mc = ({ fxn: mcFxn, label: "Marginal cost", id: "mc-curve", scheme: blue });
profit = ({ fxn: profitFxn, label: "Profit", id: "profit-curve", scheme: red });
price = ({ fxn: mrFxn, label: "Price", id: "mr-curve", scheme: green });
mr = ({ fxn: mrFxn, label: "Marginal revenue", id: "mr-curve", scheme: green });
supply = ({ fxn: supplyFxn, label: "Supply", id: "supply-curve", scheme: blue });

demandMono = ({ fxn: demandMonoFxn, label: "Demand", id: "demand-mono-curve", scheme: green });
mrMono = ({ fxn: mrMonoFxn, label: "Marginal revenue", id: "mr-mono-curve", scheme: green });
profitMono = ({ fxn: profitMonoFxn, label: "Profit", id: "profit-mono-curve", scheme: red });

demandMonoComp = ({ fxn: null, label: "Demand", id: "demand-monocomp-curve", scheme: green });
mrMonoComp = ({ fxn: null, label: "Marginal revenue", id: "mr-monocomp-curve", scheme: green });
profitMonoComp = ({ fxn: null, label: "Profit", id: "profit-monocomp-curve", scheme: red });

margin = ({ top: 50, right: 100, bottom: 40, left: 70, between: 60 });
width = 400;
height = panelHeight * 2 + margin.between;
panelHeight = 280;
fcMax = 500;
qMax = 100;
pMax = 27;

bgColor = "#EDF8FF";
blue = ({ base: "#4889ab", dull: "#A2C4D2", baseSelect: "#0C6291", dullSelect: "#669DB8"});
red = ({ base: "#C85B89", dull: "#E29FBC", baseSelect: "#B13D70", dullSelect: "#D1729A" });
green = ({ base: "#71B795", dull: "#B4D7C6", baseSelect: "#418462", dullSelect: "#73AA8E" });
gray = ({ base: "#DDDDDD", dull: "#DDDDDD", baseSelect: "#D0D0D0", dullSelect: "##D0D0D0" });
dashed = "#999999";
strokeWidth = 5;

tooltip = d3.select("body")
  .append("div")
  .attr("class", "toolTip")
  .style("display", "none")
  .style("position", "absolute")
  .style("width", 100)
  .style("height", 20)
  .style("background", "#f7f7f7")
  .style("border", "1px solid #cecece")
  .style("opacity", .9)
  .style("padding", ".2em .45em")
  .style("font-size", ".85rem");

line = d3.line().curve(d3.curveBasis);

xScaler = d3.scaleLinear()
  .domain([0, qMax])
  .range([0, width]);

data = (fxn, params, yScaler) => {
  const q = params.q, p = params.p, fc = params.fc, c = params.c;
  return Array.from({ length: q + 1 }, (_, i) => {
    const y = yScaler(fxn({ q: i, p, fc, c })) ?? -500;
    const x = (y == null) ? null : xScaler(i);
    return [x, y];
  })
};

dataMax = (fxn, params, yScaler) => {
  const q = qMax, p = params.p, fc = params.fc, c = params.c;
  return Array.from({ length: q + 1 }, (_, i) => {
    const y = yScaler(fxn({ q: i, p, fc, c })) ?? -500;
    const x = (y == null) ? null : xScaler(i);
    return [x, y];
  })
};

background = selection => {
  selection.append("rect")
    .attr("x", 0).attr("y", 0)
    .attr("width", selection.attr("width"))
    .attr("height", selection.attr("height"))
    .style("fill", bgColor)
    .style("stroke", "#E0EDFB")
    .style("stroke-width", 8);
  return selection.node()
}
Code
addCurve = (selection, id, fxnInfo, params, yScaler) => {

  const point = data(fxnInfo.fxn, params, yScaler)[params.q]

  const curves = selection.append("g")
    .attr("id", `${fxnInfo.id}-${id}`)
    .attr("pointer-events", "visibleStroke")
  
  // Non-highlighted portion
  curves.append("path")
    .attr("class", "curve dulled")
    .attr("d", line(dataMax(fxnInfo.fxn, params, yScaler)))
    .style("fill", "none")
    .style("stroke", fxnInfo.scheme.dull)
    .style("stroke-width", strokeWidth)
  
  // Highlighted portion
  curves.append("path")
    .attr("class", "curve colored")
    .attr("d", line(data(fxnInfo.fxn, params, yScaler)))
    .style("fill", "none")
    .style("stroke", fxnInfo.scheme.base)
    .style("stroke-width", strokeWidth)
  
  // Add hover effects
  curves
    .on("mousemove", (event) => {
      d3.selectAll(`#${fxnInfo.id}-${id} .curve.colored`)
        .transition().duration(50)
        .style("stroke-width", strokeWidth + 2)
        .style("stroke", fxnInfo.scheme.baseSelect);
      d3.selectAll(`#${fxnInfo.id}-${id} .curve.dulled`)
        .transition().duration(50)
        .style("stroke-width", strokeWidth + 2)
        .style("stroke", fxnInfo.scheme.dullSelect);
      tooltip
        .style("left", event.pageX + 18 + "px")
        .style("top", event.pageY + 18 + "px")
        .style("display", "block")
        .text(fxnInfo.label);
      d3.select(event.target).style("cursor", "pointer");
    })
    .on("mouseleave", (event) => {
      d3.selectAll(`#${fxnInfo.id}-${id} .curve.colored`)
        .transition().duration(100)
        .style("stroke-width", strokeWidth)
        .style("stroke", fxnInfo.scheme.base);
      d3.selectAll(`#${fxnInfo.id}-${id} .curve.dulled`)
        .transition().duration(100)
        .style("stroke-width", strokeWidth)
        .style("stroke", fxnInfo.scheme.dull);
      tooltip.style("display", "none");
      d3.select(event.target).style("cursor", "default");
    });

  return selection.node()
}

addCurveFull = (selection, id, fxnInfo, params, yScaler, scheme = fxnInfo.scheme) => {
  
  const curves = selection.append("g")
    .attr("id", `${fxnInfo.id}-${id}`)
    .attr("pointer-events", "visibleStroke");
  
  curves.append("path")
    .attr("class", "curve")
    .attr("d", line(dataMax(fxnInfo.fxn, params, yScaler)))
    .style("fill", "none")
    .style("stroke", scheme.base)
    .style("stroke-width", strokeWidth)

  // Add hover effects
  curves
    .on("mousemove", (event) => {
      d3.selectAll(`#${fxnInfo.id}-${id} .curve`)
        .transition().duration(50)
        .style("stroke-width", strokeWidth + 2)
        .style("stroke", scheme.baseSelect);
      tooltip
        .style("left", event.pageX + 18 + "px")
        .style("top", event.pageY + 18 + "px")
        .style("display", "block")
        .text(fxnInfo.label);
      d3.select(event.target).style("cursor", "pointer");
    })
    .on("mouseleave", (event) => {
      d3.selectAll(`#${fxnInfo.id}-${id} .curve`)
        .transition().duration(100)
        .style("stroke-width", strokeWidth)
        .style("stroke", scheme.base);
      tooltip.style("display", "none");
      d3.select(event.target).style("cursor", "default");
    });

  return selection.node()
}

addArea = (selection, id, info, corners) => {
  
  const area = selection.append("path")
    .attr("id", `area-${info.id}-${id}`)
    .attr("d", d3.line()([ 
      [corners.x1, corners.y1], 
      [corners.x2, corners.y1],
      [corners.x2, corners.y2],
      [corners.x1, corners.y2]
    ]))
    .style("opacity", .25)
    .style("fill", "#7fc6a4")
  
  // Add hover effects
  area
    .on("mousemove", (event) => {
      d3.selectAll(`#area-${info.id}-${id}`)
        .transition().duration(50)
        .style("opacity", .5);
      tooltip
        .style("left", event.pageX + 18 + "px")
        .style("top", event.pageY + 18 + "px")
        .style("display", "block")
        .text(info.label);
      d3.select(event.target).style("cursor", "pointer");
    })
    .on("mouseleave", (event) => {
      d3.selectAll(`#area-${info.id}-${id}`)
        .transition().duration(50)
        .style("opacity", .25);
      tooltip.style("display", "none");
      d3.select(event.target).style("cursor", "default");
    });

  return selection.node()
}

clip = (selection, id) => {
  
  selection.attr("clip-path", `url(#clip-${id})`);
  
  const clip = selection.append("clipPath")
    .attr("id", `clip-${id}`);
  clip.append("rect")
    .attr("x", 0)
    .attr("y", 0)
    .attr("width", width + margin.right)
    .attr("height", panelHeight)
    .style("fill", "white");
    
  return selection.node();
}

clipWide = (selection, id) => {
  
  selection.attr("clip-path", `url(#clip-wide-${id})`);
  
  const clip = selection.append("clipPath")
    .attr("id", `clip-wide-${id}`);
  clip.append("rect")
    .attr("x", 0)
    .attr("y", 0)
    .attr("width", width + margin.right)
    .attr("height", panelHeight)
    .style("fill", "white");
  clip.append("rect")
    .attr("x", -margin.left)
    .attr("y", -10)
    .attr("width", margin.left)
    .attr("height", panelHeight + 20)
    .style("fill", "white");
  
  return selection.node();
}
Code
panelAxes = (selection, titles) => {
  
  const axes = selection.append("g")
  
  // Axis lines
  axes.append("path")
    .attr("d", d3.line()([[width, panelHeight], [0, panelHeight], [0, 0]]))
    .style("fill", "none")
    .style("stroke", "black")
    .style("stroke-width", 2);
  
  // Axis titles    
  axes.append("text")
    .text(titles.x)
    .attr("x", width + 10)
    .attr("y", panelHeight)
    .style("fill", "black")
    .style("font-size", ".9rem")
    .style("text-anchor", "start")
    .style("alignment-baseline", "middle");
  axes.append("text")
    .text(titles.y)
    .attr("x", 0)
    .attr("y", -15)
    .style("fill", "black")
    .style("font-size", ".9rem")
    .style("text-anchor", "middle");

  return selection.node()
}

panelAxesT = (selection, titles, yScaler) => {
  
  const axes = selection.append("g")
  
  // Axis lines
  axes.append("path")
    .attr("d", d3.line()([[0, yScaler(0)], [width, yScaler(0)]]))
    .style("stroke", "black")
    .style("stroke-width", 2);
  axes.append("path")
    .attr("d", d3.line()([[0, 0], [0, panelHeight]]))
    .style("stroke", "black")
    .style("stroke-width", 2);
  
  // Axis titles
  axes.append("text")
    .text(titles.x)
    .attr("x", width + 10)
    .attr("y", yScaler(0))
    .style("fill", "black")
    .style("font-size", ".9rem")
    .style("text-anchor", "start")
    .style("alignment-baseline", "middle");
  axes.append("text")
    .text(titles.y)
    .attr("x", 0)
    .attr("y", -15)
    .style("fill", "black")
    .style("font-size", ".9rem")
    .style("text-anchor", "middle");

  return selection.node()
}

xGuides = (selection, fxnInfo, params, yScaler, panels = 2) => {
  
  const point = data(fxnInfo.fxn, params, yScaler)[params.q];
  const guide = selection.append("g");
  
  // Dashed line
  const dashedLine = guide.append("path")
    .attr("d", line([[point[0], point[1]], [point[0], panelHeight * 2 + margin.between]]))
    .attr("fill", "none")
    .attr("stroke", dashed)
    .attr("stroke-dasharray", "4 4");
  
  // Tick
  const tick = guide.append("text")
    .text(d3.format(",.0f")(params.q))
    .attr("x", xScaler(params.q))
    .attr("y", panelHeight * 2 + margin.between)
    .attr("dy", 10)
    .attr("text-anchor", "middle")
    .attr("alignment-baseline", "hanging")
    .style("fill", "black")
    .style("font-size", ".9rem");
    
  if (panels === 1) {
    dashedLine.attr("d", line([[point[0], point[1]], [point[0], panelHeight]]));
    tick.attr("y", panelHeight)
  }
   
  return selection.node()
}
  
yGuide = (selection, fxnInfo, params, yScaler, format = ",.0f") => {
  
  const point = data(fxnInfo.fxn, params, yScaler)[params.q]
  const guide = selection.append("g")
  
  // Dashed line
  guide.append("g")
    .append("path")
    .attr("d", line([[point[0], point[1]], [0, point[1]]]))
    .attr("fill", "none")
    .attr("stroke", dashed)
    .attr("stroke-dasharray", "4 4")
  
  // Axis tick
  guide.append("g")
    .append("text")
    .text(d3.format(format)(fxnInfo.fxn(params)))
    .attr("x", 0)
    .attr("y", point[1])
    .attr("dx", -10)
    .attr("text-anchor", "end")
    .attr("alignment-baseline", "middle")
    .style("fill", "black")
    .style("font-size", ".9rem");
  
  return selection.node()
}
Code
addLabel = (selection, label, x, y, anchor = "start") => {
  selection.append("text")
    .text(label)
    .attr("x", x)
    .attr("y", y)
    .attr("text-anchor", anchor)
    .attr("alignment-baseline", "middle")
    .style("fill", "black")
    .style("font-size", ".9rem")
    .style("font-weight", "bold");
  return selection.node()
}

labelsToggle = (selection, id) => {

  const checkbox = selection.append("foreignObject")
    .attr("x", width + margin.left + 10)
    .attr("y",  15)
    .attr("width", 20)
    .attr("height", 20);
  
  checkbox.append("xhtml:input")
    .attr("type", "checkbox")
    .attr("id", `checkbox-${id}`)
    .property("checked", true);
  
  selection.append("g")
    .append("text")
    .text("Labels")
    .attr("x", width + margin.left + margin.right - 25)
    .attr("y", 20)
    .attr("text-anchor", "end")
    .attr("alignment-baseline", "hanging")
    .style("fill", "#84b0c5");
  
  return selection.node()
}

Footnotes

  1. The numbers in this and all the charts are a little imprecise. This is because, for simplicity, I’m only letting \(q\) take integer values whereas the mathematics of optimization assumes we can pick any \(q\) we want, be it 59 or 59.000001.↩︎

  2. Why the MR curve’s slope should specifically be twice that of the demand curve’s stems from the fact that MR takes twice the impact of each additional increase in \(q\). If \(q\) increases by 1, the price associated with that level of demand falls by, let’s say, \(b\) units. Meanwhile, for every unit of \(b\), MR loses one unit from the price drop and one unit from the price adjustment via the demand curve. Thus it falls by twice \(b\).↩︎

Reuse